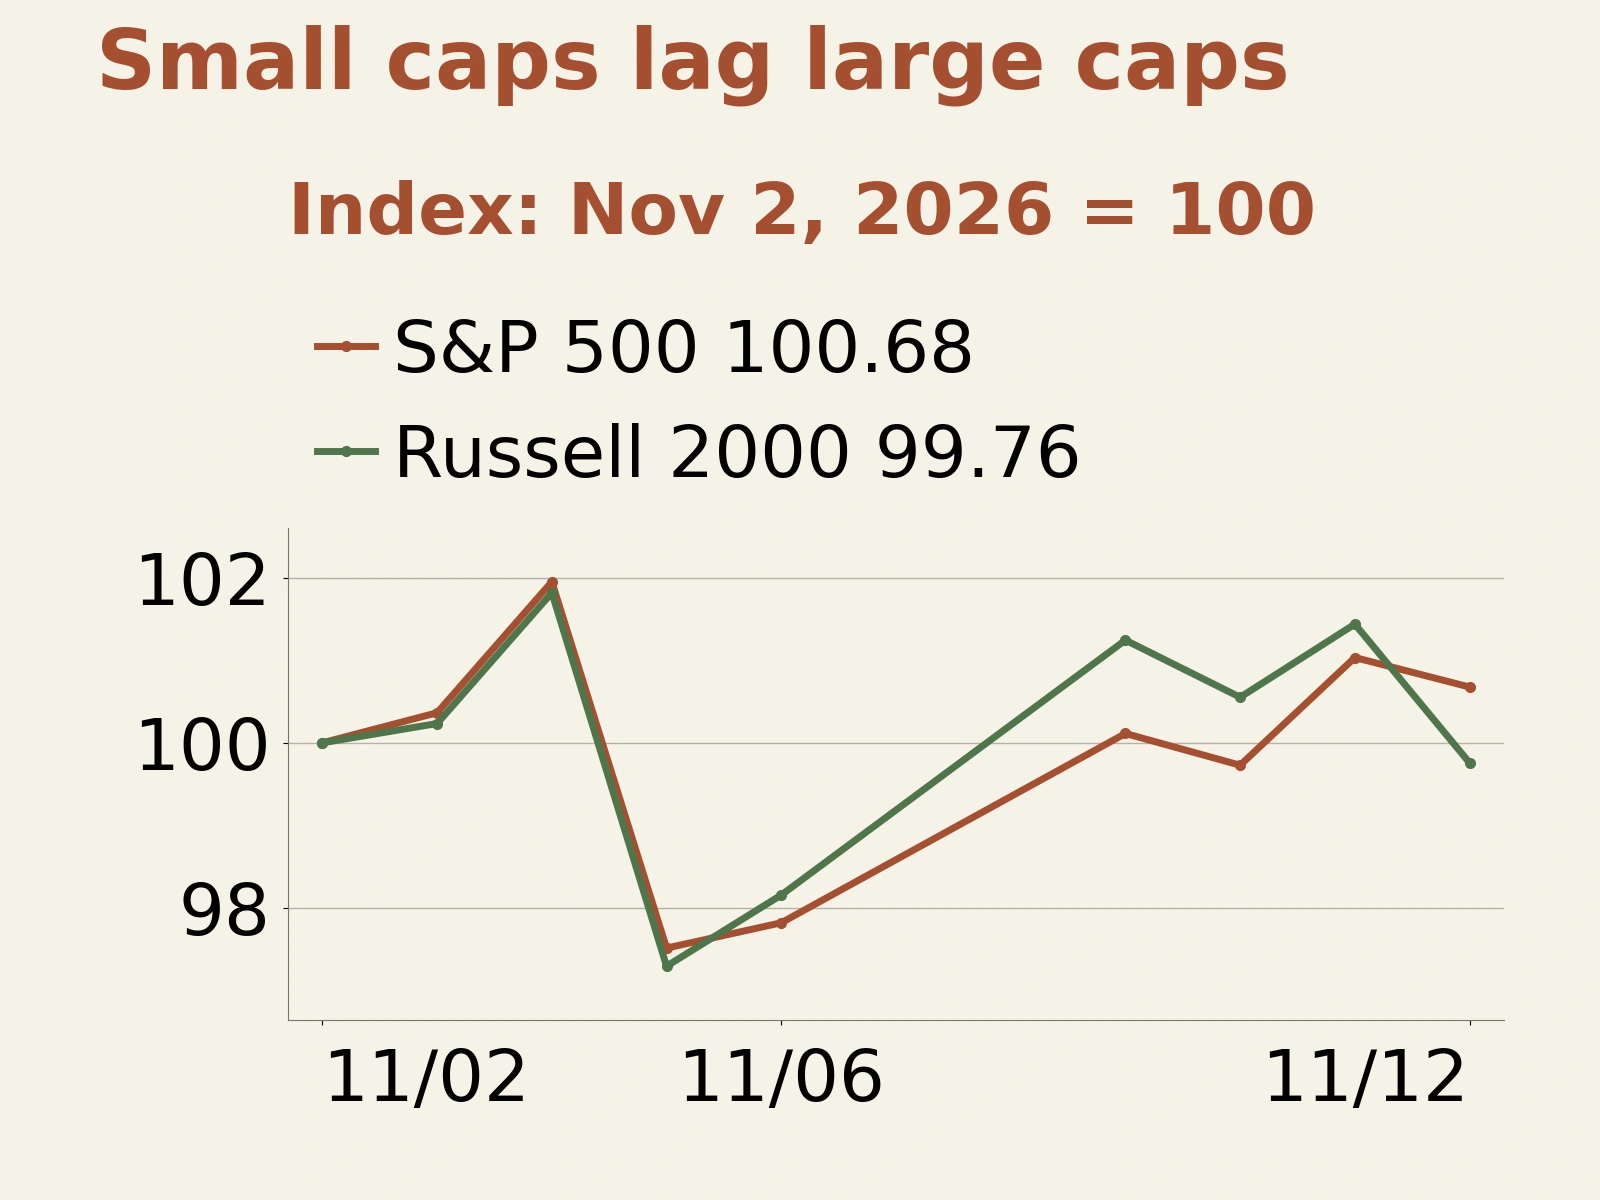
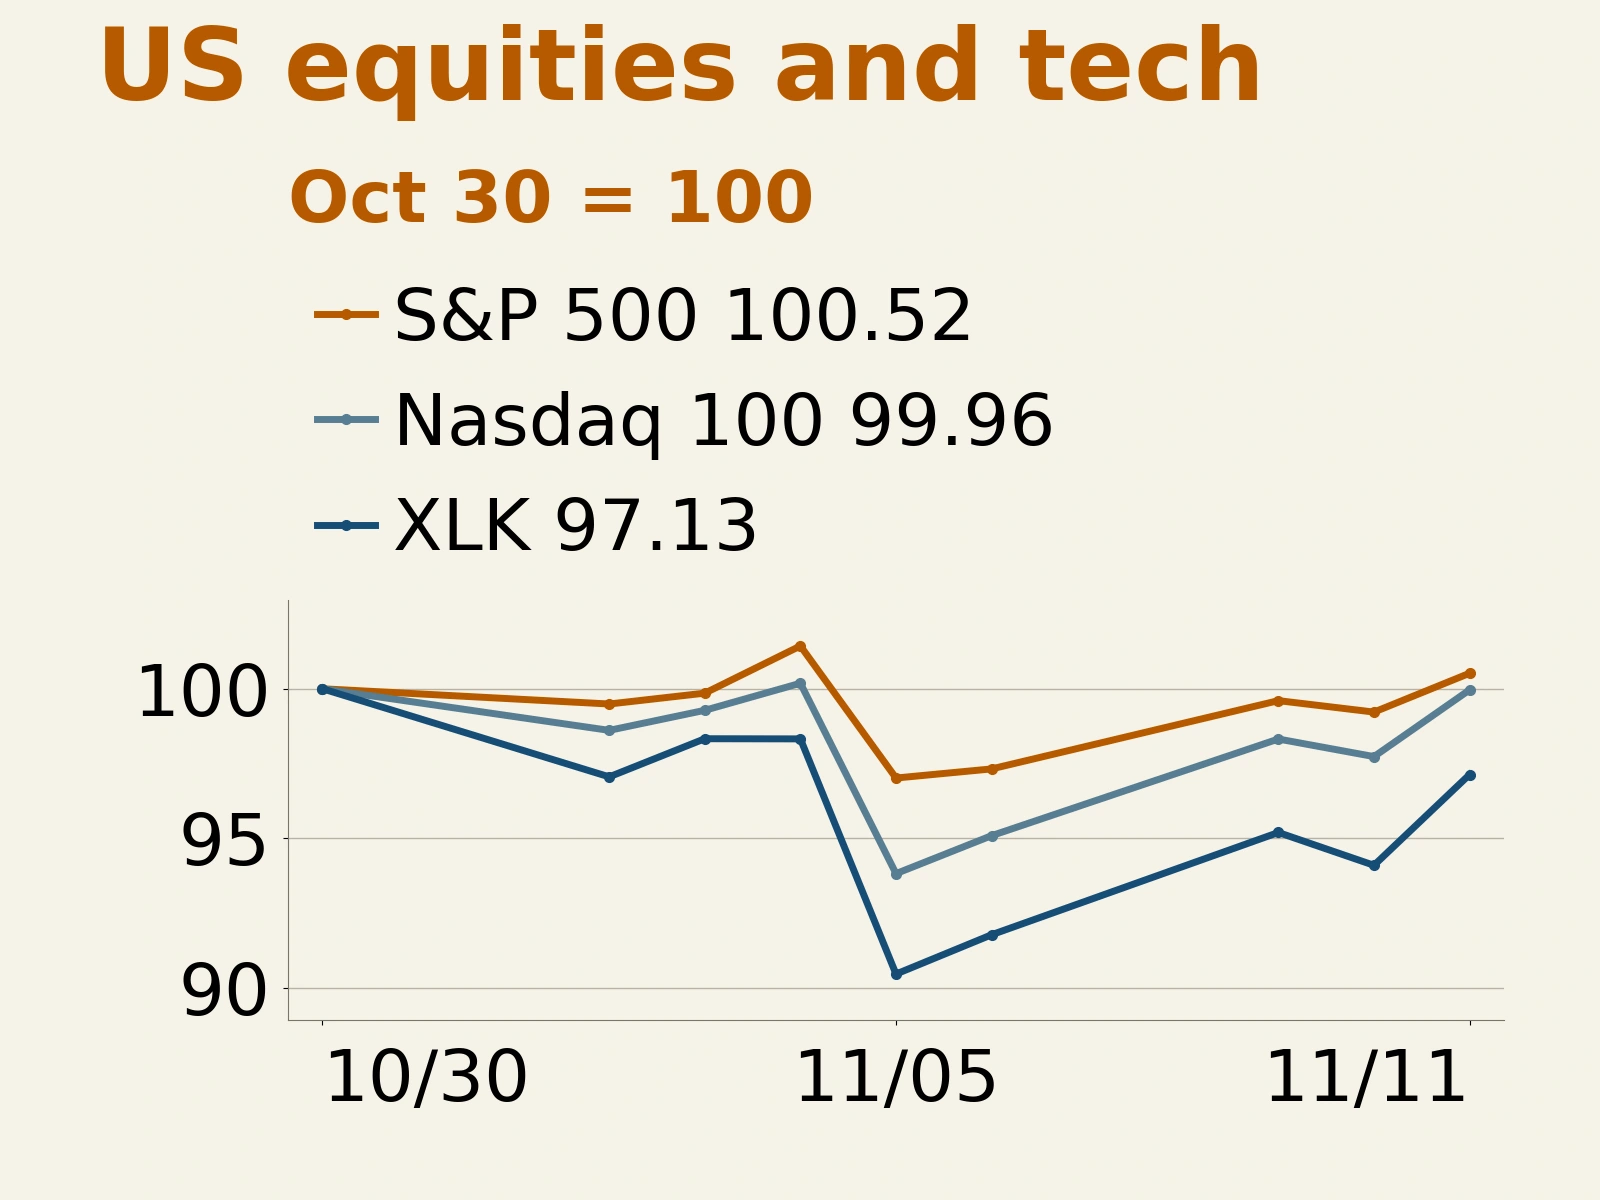
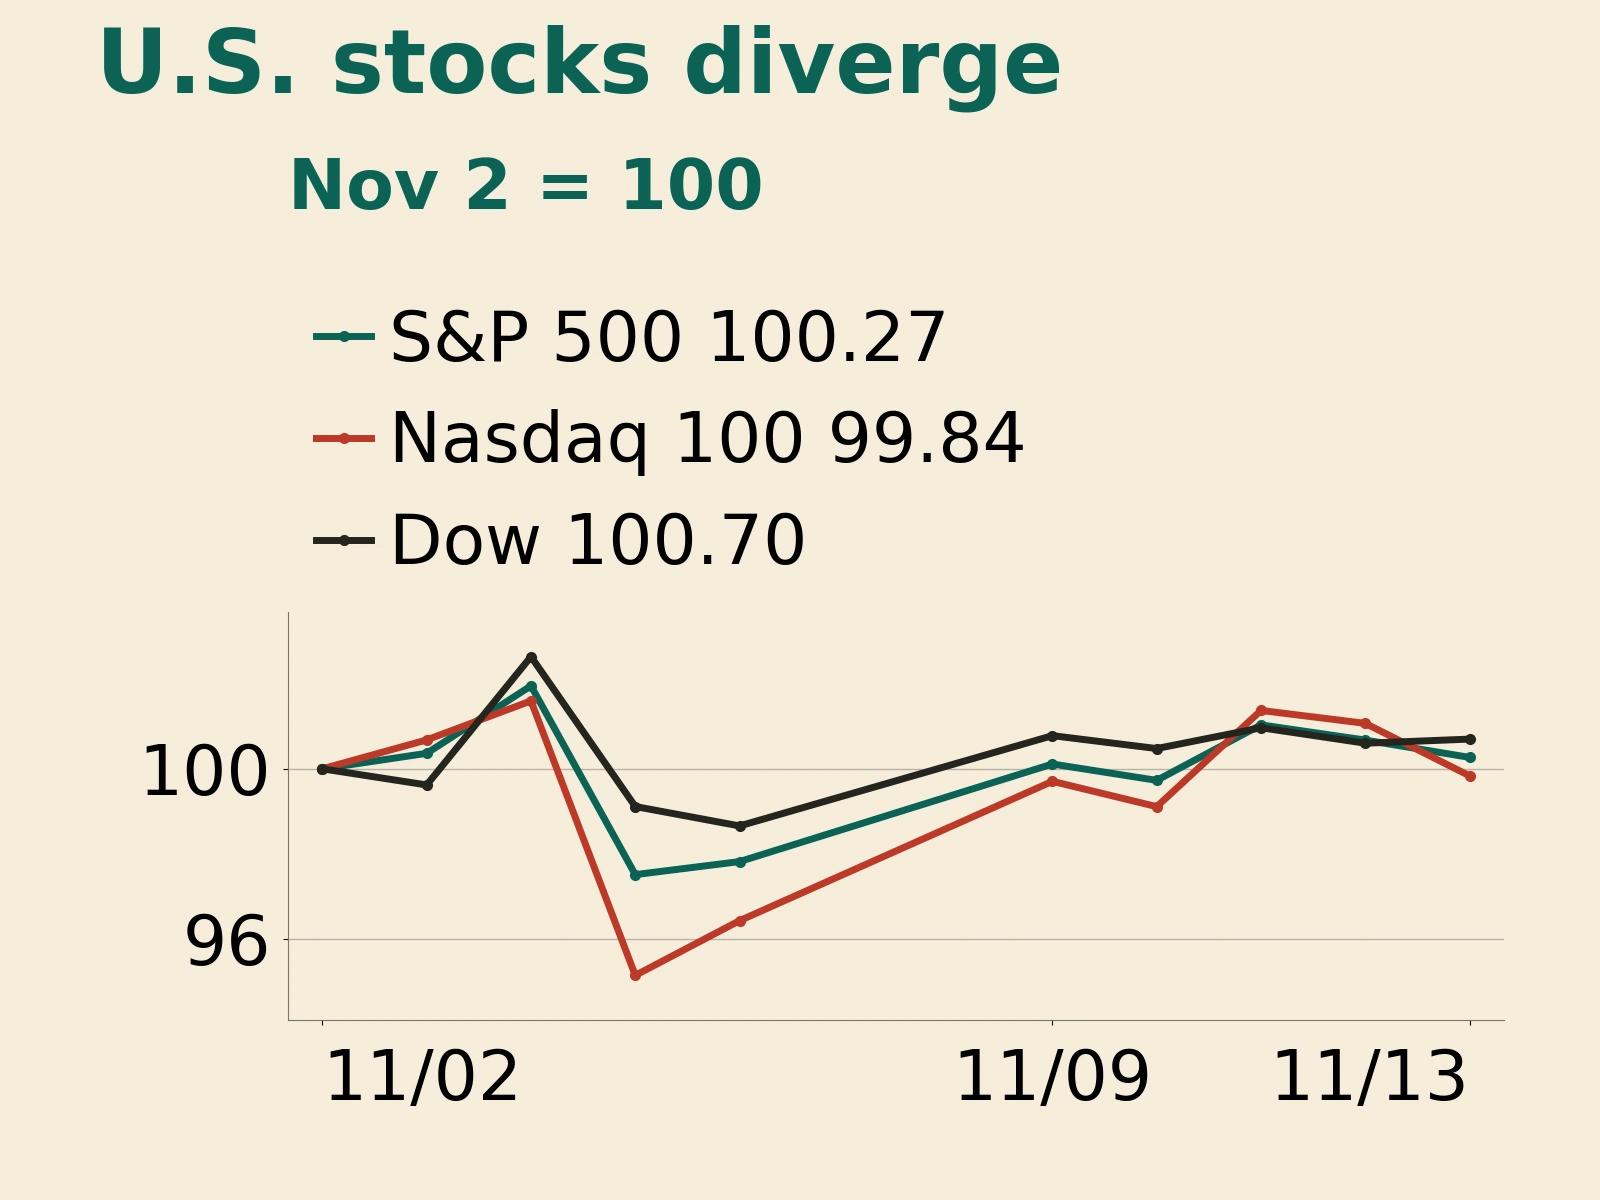
On November 13, 2026, U.S. producer-price inflation for October came in below market expectations, yet Treasury yields continued to rise and technology stocks once again led the decline. The S&P 500 closed down 0.40%, the Nasdaq 100 fell 1.22%, and the Dow Jones Industrial Average edged up 0.10%; the 10-year Treasury yield rose to 5.15%. With upstream cost relief still insufficient and the artificial intelligence (AI) industry facing uncertainty over leadership transitions, financing arrangements and export controls, investors continued rotating toward traditional sectors.
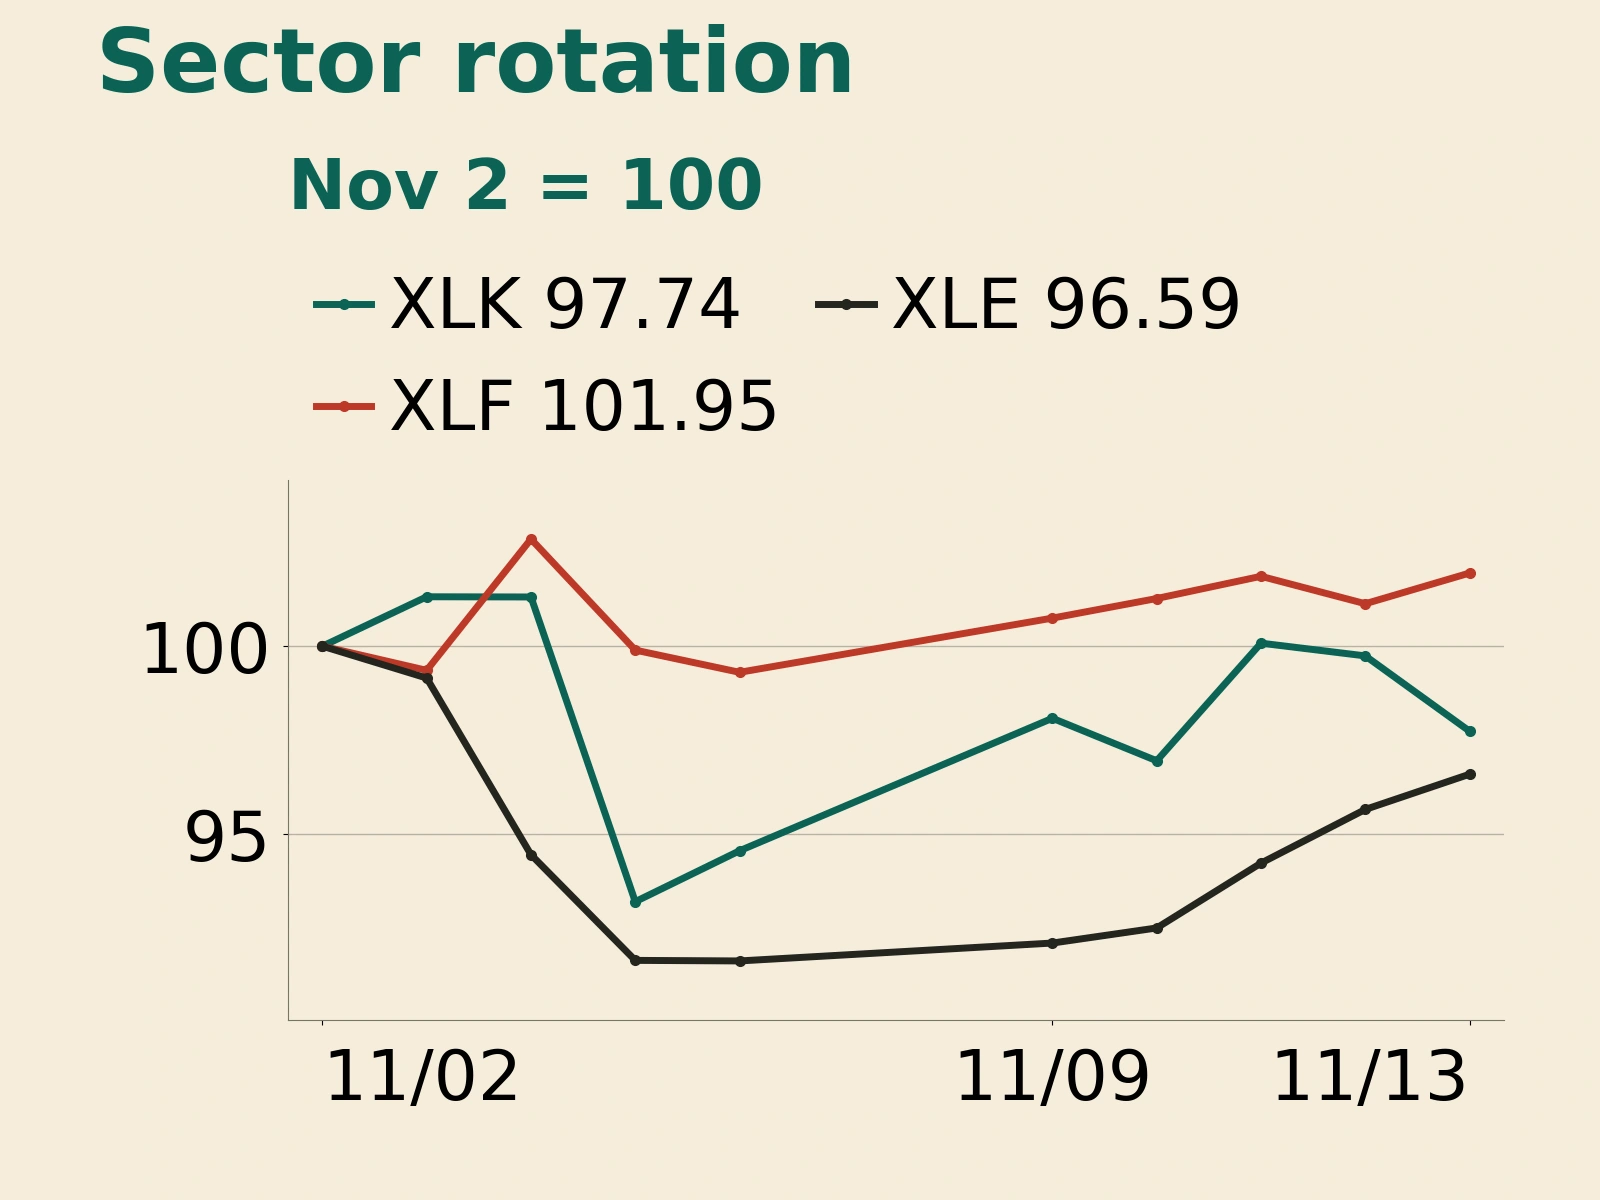
Sector performance diverged sharply: the technology-sector ETF (XLK) fell 2.01%, while the financial-sector ETF (XLF) and energy-sector ETF (XLE) gained 0.81% and 0.98%, respectively. In currencies and commodities, the dollar index rose 0.23% to 103.411, while crude oil and gold prices stabilized only modestly. In an environment of high discount rates, sectors' ability to deliver current earnings and maintain stable financing is increasingly separating asset valuations.
October PPI slows to 0.3% month on month, but processing and logistics costs keep rising
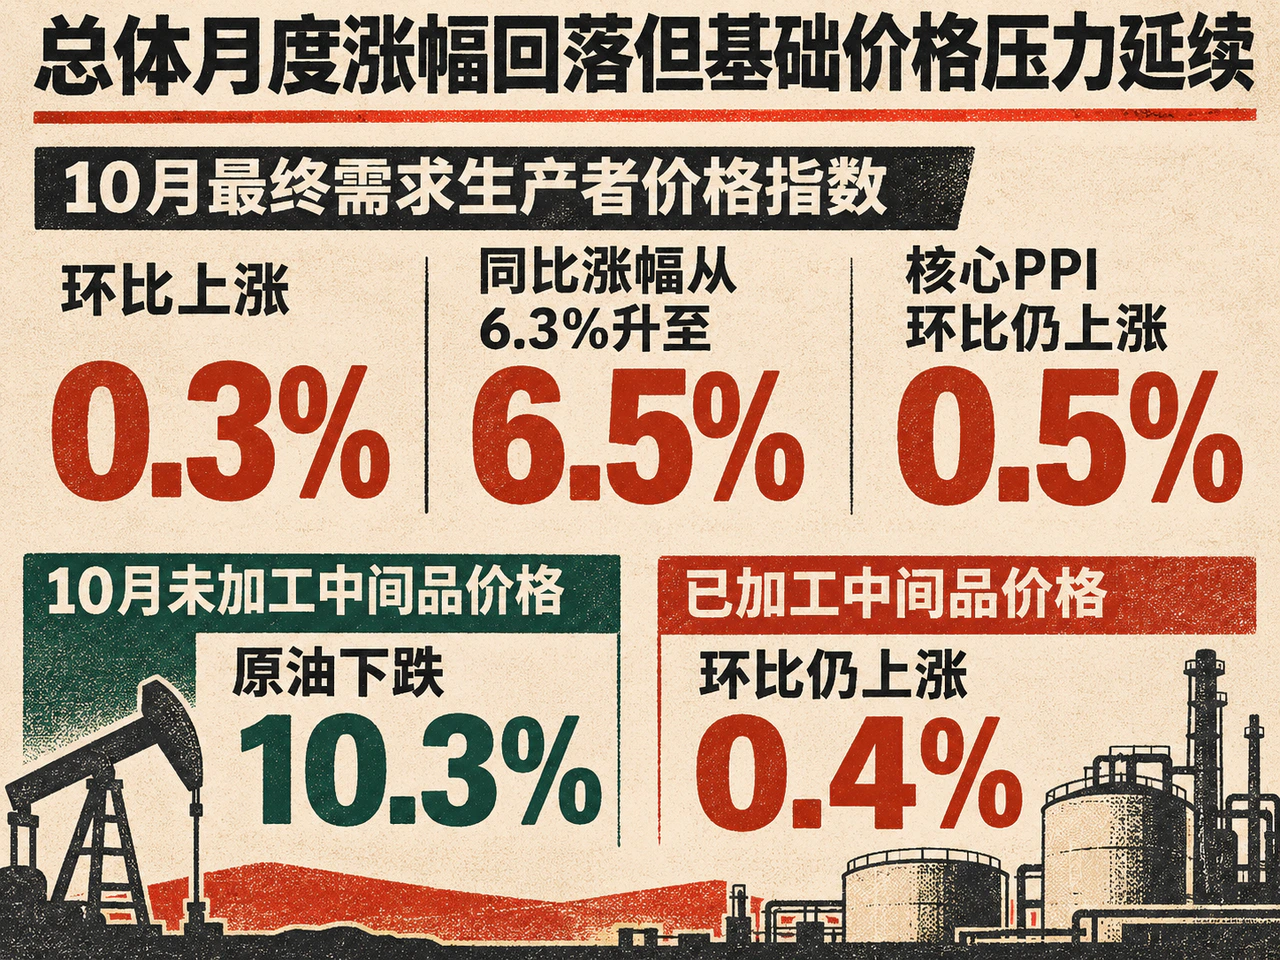
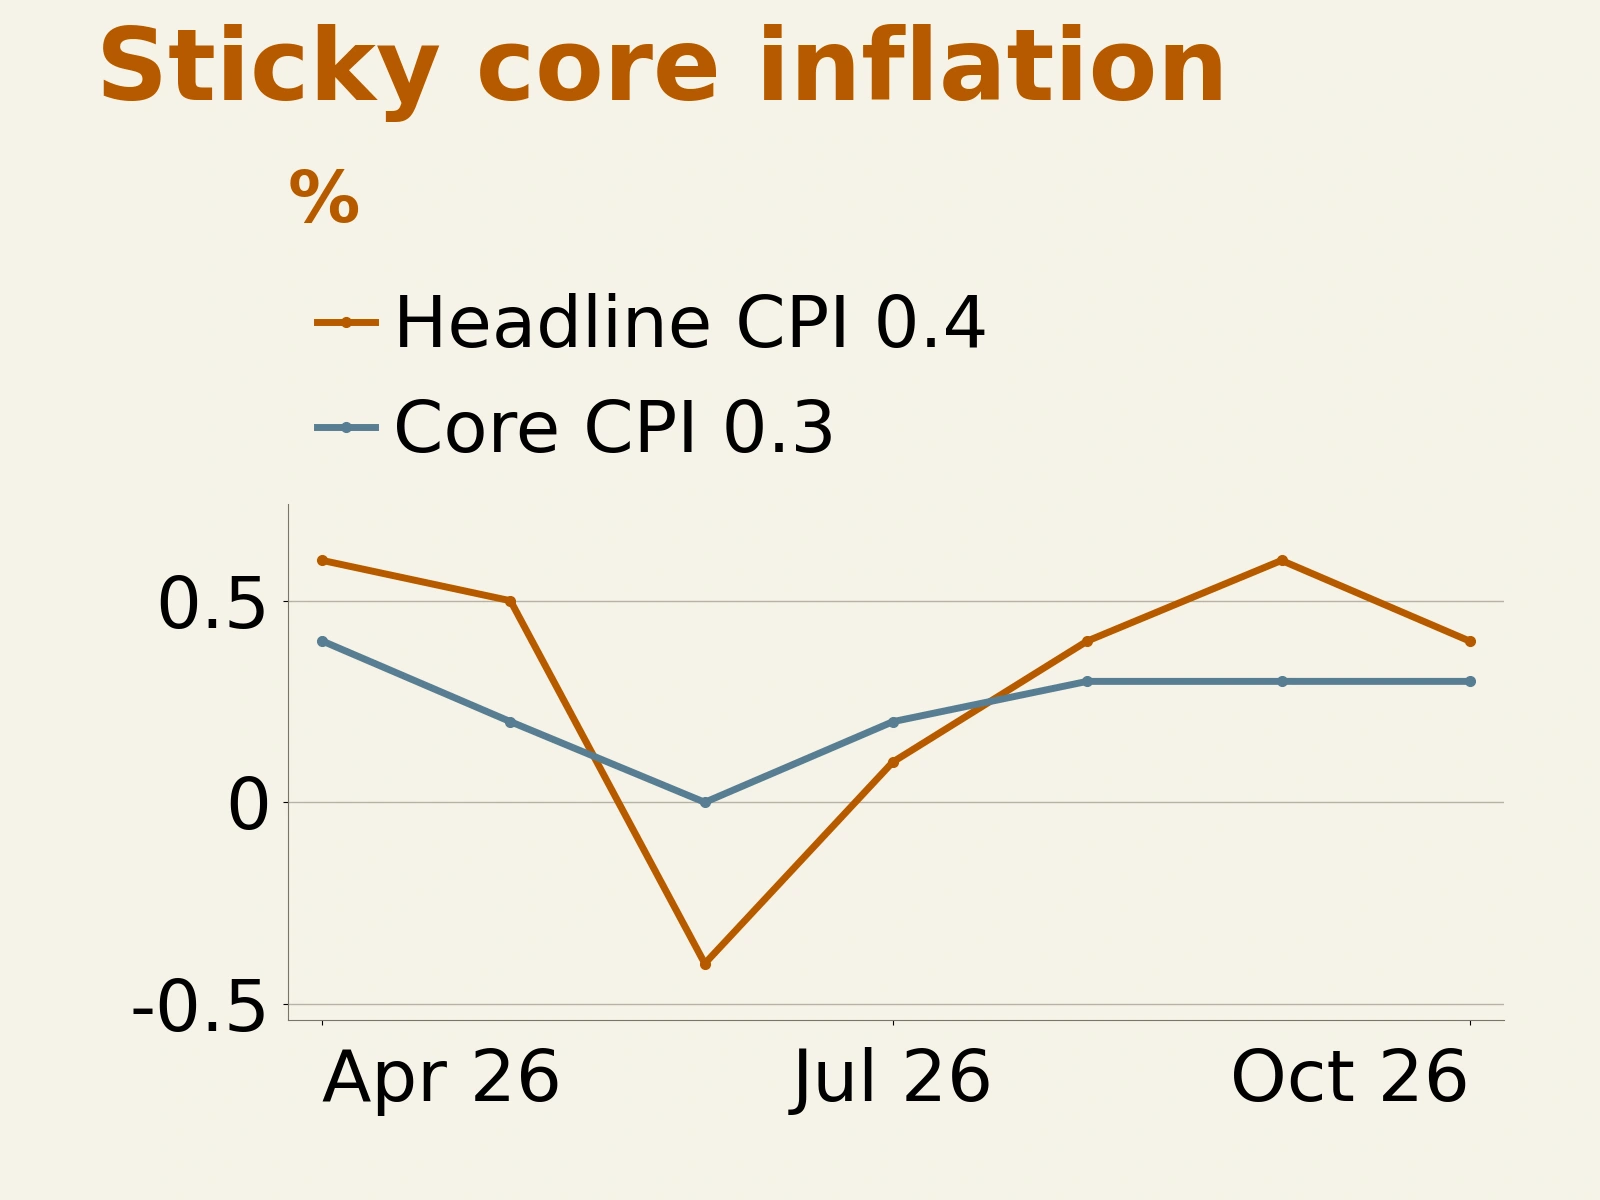
According to the U.S. Bureau of Labor Statistics, the final-demand producer price index (PPI) rose a seasonally adjusted 0.3% in October from the previous month, below the survey consensus of 0.4% and sharply slower than September's 1.4% increase. However, the unadjusted year-on-year increase accelerated from 6.3% to 6.5%, its highest since November 2022. Although the monthly slowdown offered brief relief, the components showed no corresponding easing in underlying inflation pressure.
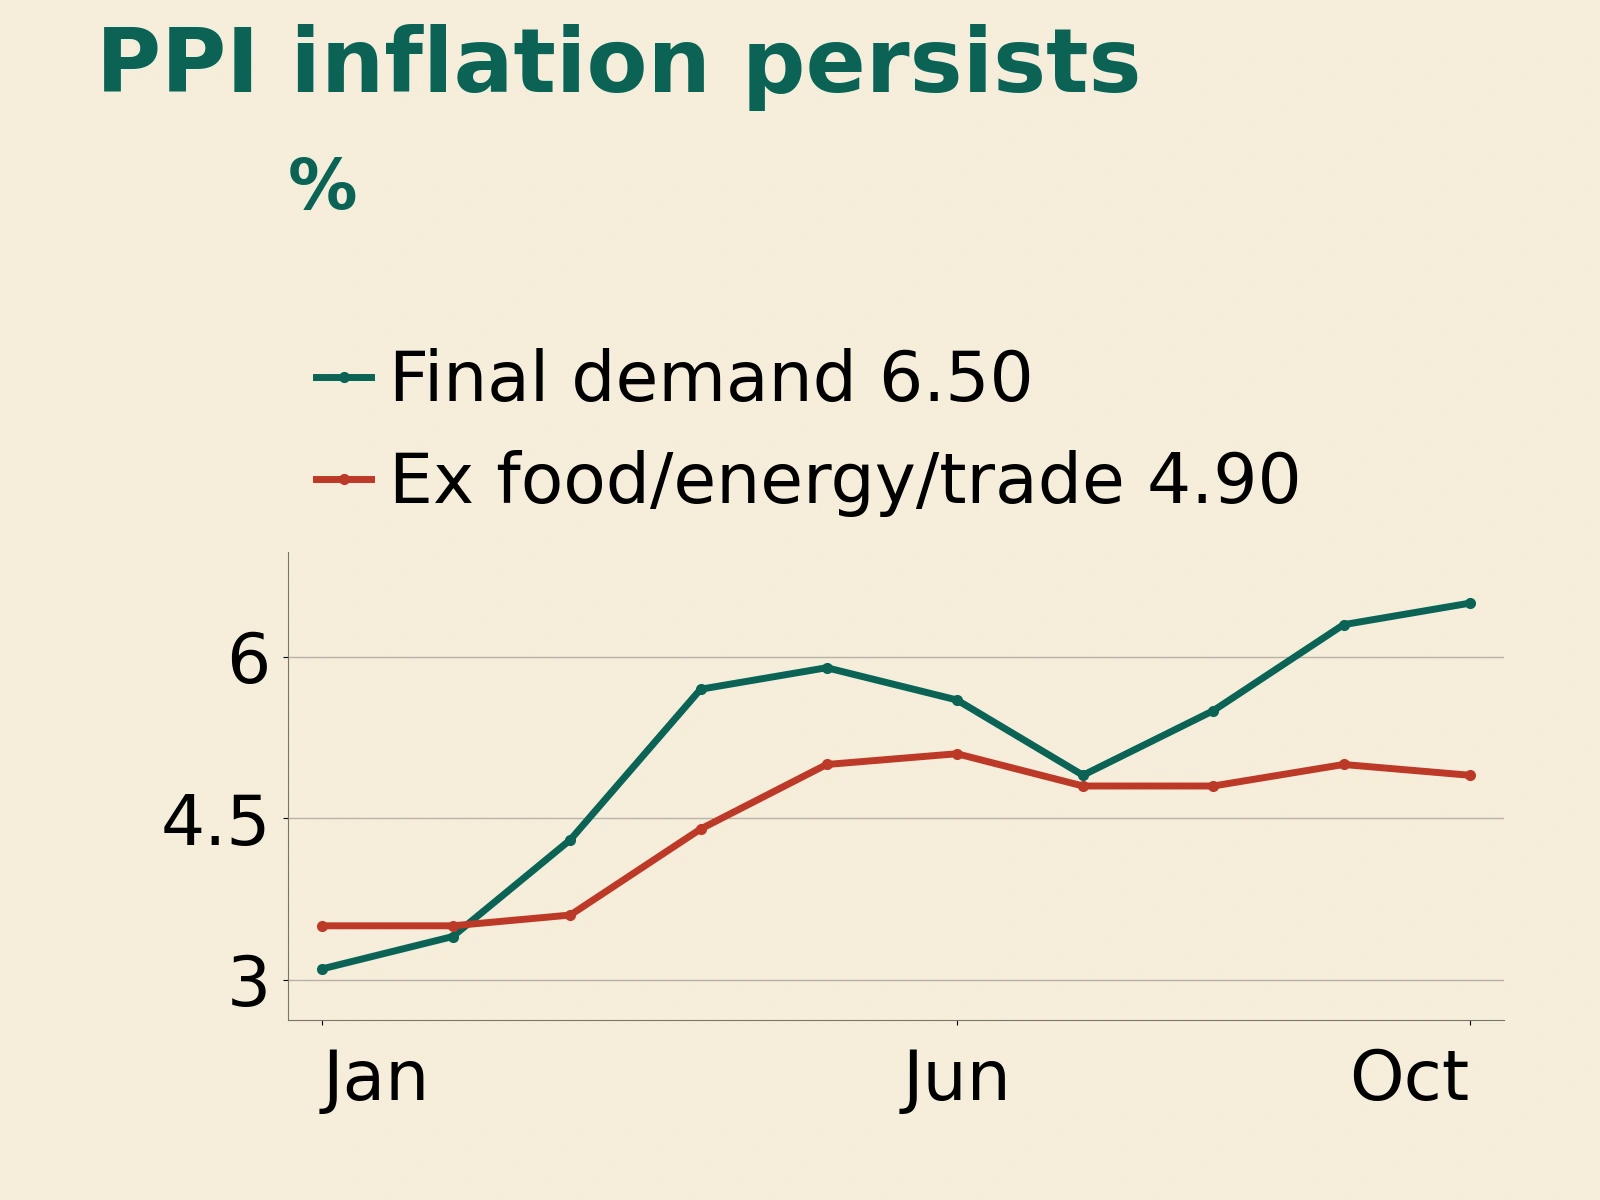
Energy prices fell 0.1% month on month, including a 7.9% decline in diesel, weighing on the headline index. Nevertheless, final-demand goods prices still rose 0.5%, with core goods excluding food and energy accounting for more than 60% of that increase. Food prices rose 1.3%, and transportation and warehousing services increased 2.0%. Overall services prices edged up just 0.2%, held down by a 0.2% decline in wholesale and retail trade-service margins. Excluding food, energy and trade services, core PPI still rose 0.5% month on month, matching September's pace, and increased 4.9% year on year.
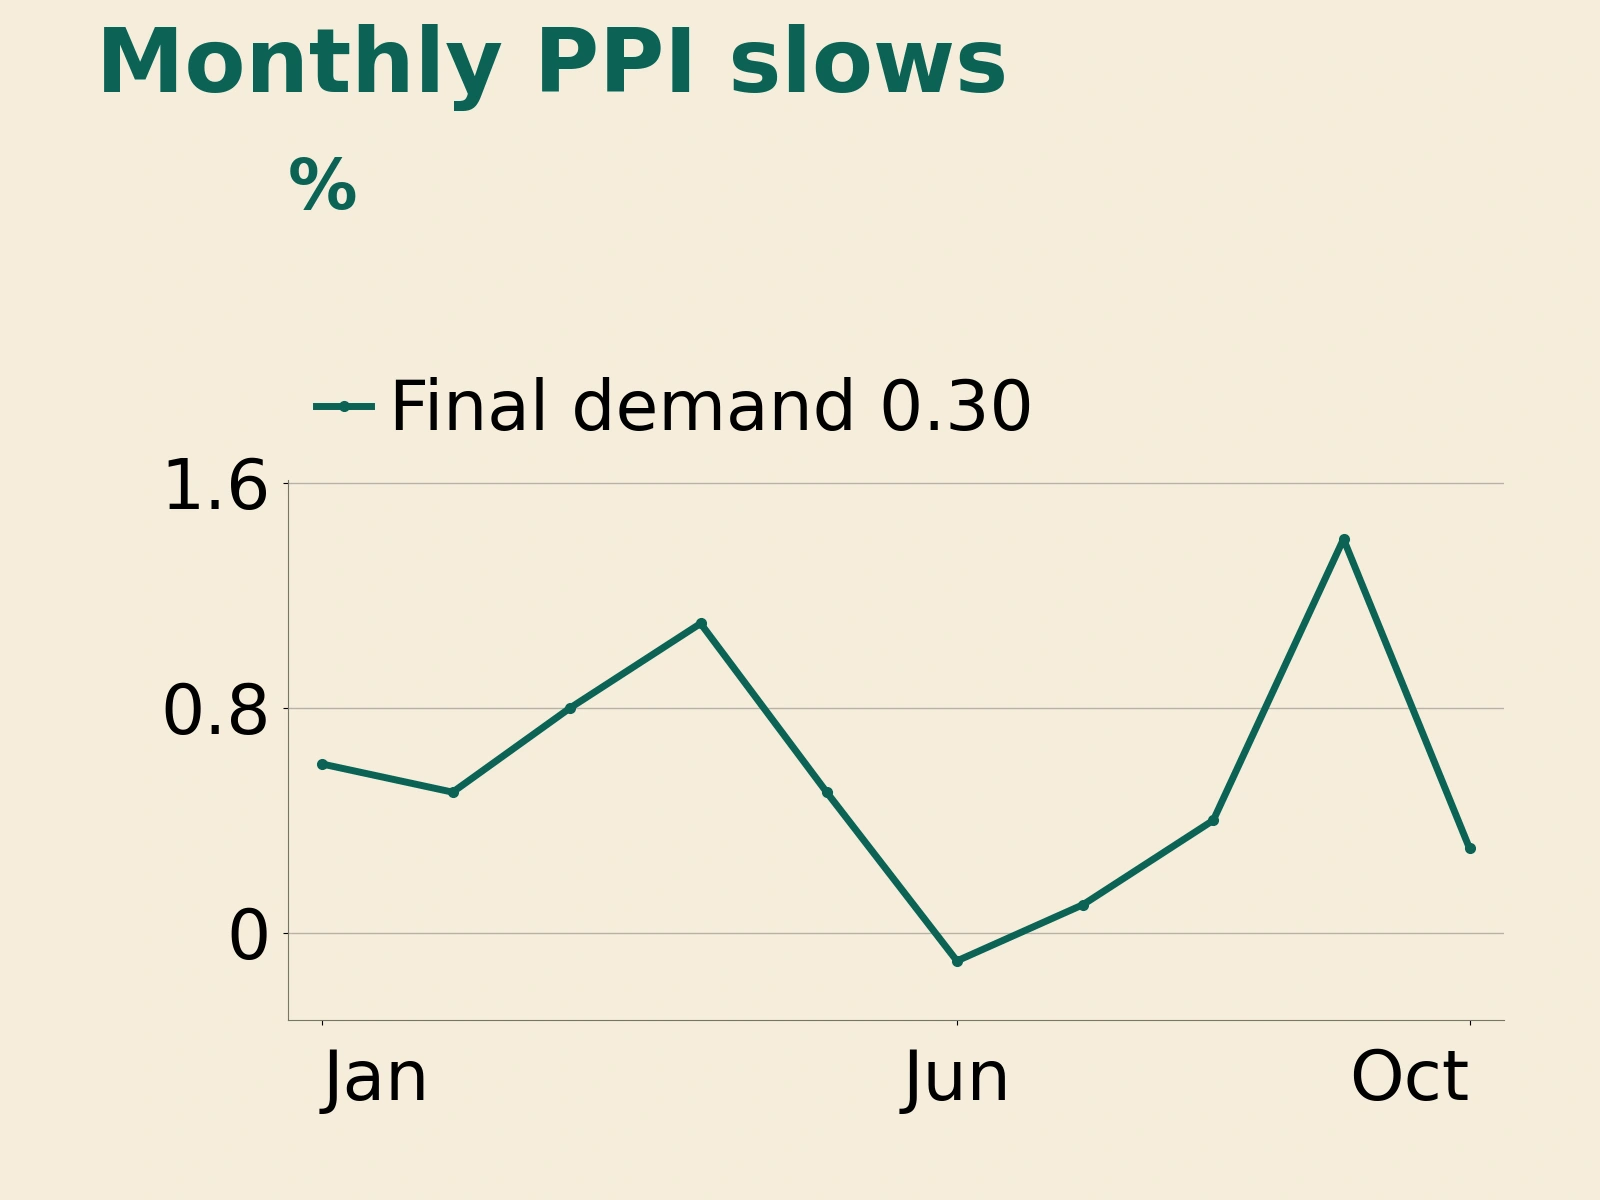
Supply-chain pricing data further suggest that cheaper upstream raw materials have yet to meaningfully ease costs in the middle and downstream stages. Prices for unprocessed intermediate goods fell 3.1% in October from the previous month, including a 10.3% drop in crude oil, while processed intermediate goods prices still rose 0.4% month on month and a substantial 14.6% year on year. With logistics, processing and non-energy goods continuing to become more expensive, companies still face a choice between absorbing costs and squeezing margins, or passing further price increases on to end customers.
CNBC reported that U.S. equity futures briefly extended their gains after the PPI release, but trading during the day failed to sustain the combination of falling rates and recovering technology valuations. Chris Zaccarelli, chief investment officer at Northlight Asset Management, noted that although the data showed signs of improvement, the absolute level of inflation remained high and was insufficient to change market expectations for December monetary policy. Attention is shifting to U.S. October retail sales and industrial production, due on November 17. If final demand remains resilient, companies' ability to pass on costs and the constraints on monetary policy will persist; if demand weakens, markets will need to reassess corporate margins and the growth outlook.
The 10-year real yield reaches 2.91%, while credit spreads remain narrower
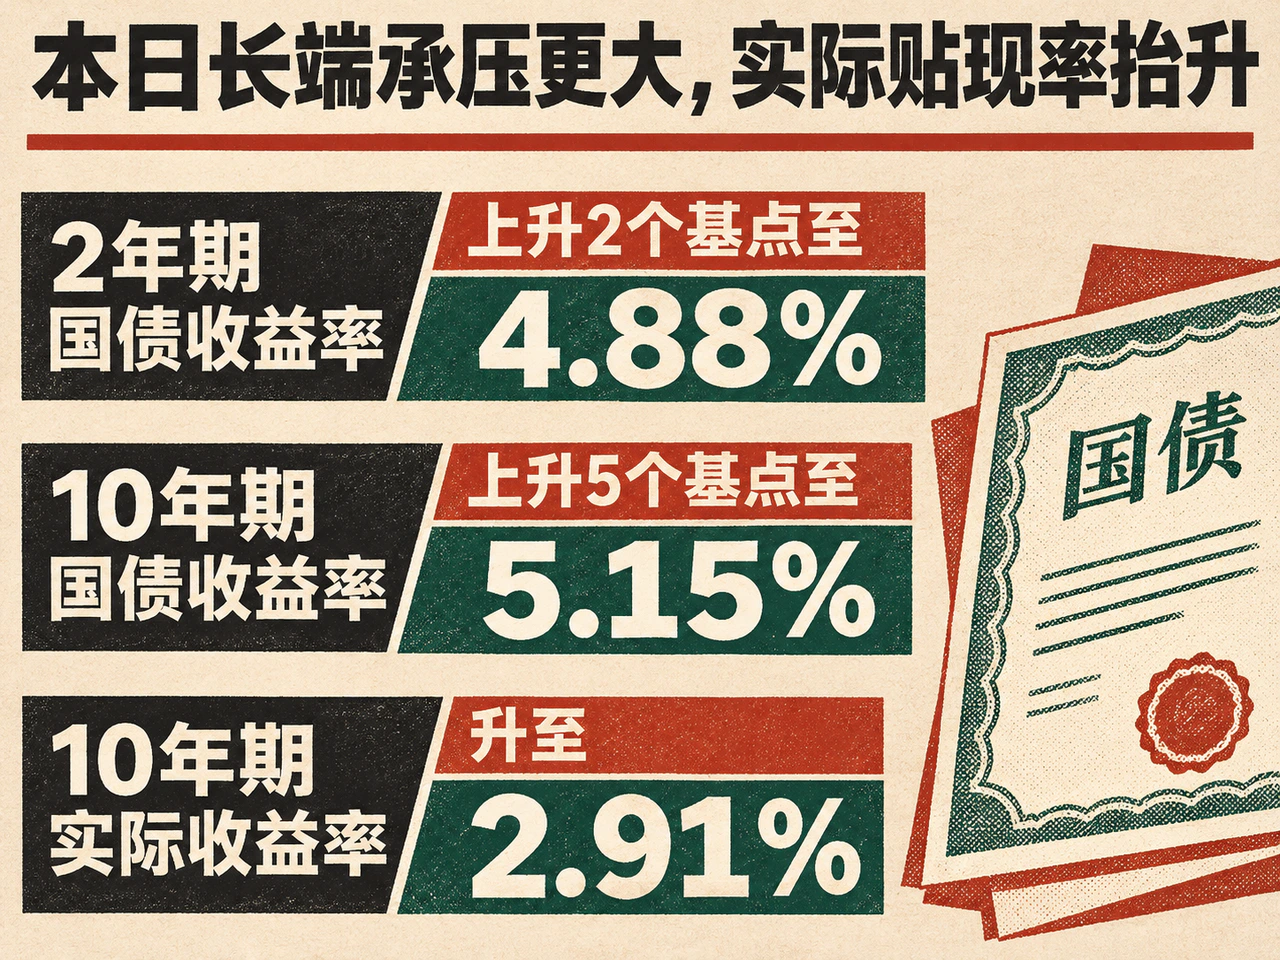
U.S. Treasuries weakened further on Friday, November 13, with the long end under particularly heavy pressure. Treasury Department closing data showed the two-year yield rising 2 basis points from the previous day to 4.88%, the five-year yield rising 3 basis points to 4.98%, the 10-year yield gaining 5 basis points to 5.15%, and the 30-year yield increasing 4 basis points to 5.47%. The spread between two- and 10-year Treasuries widened from 24 basis points the previous day to 27 basis points.
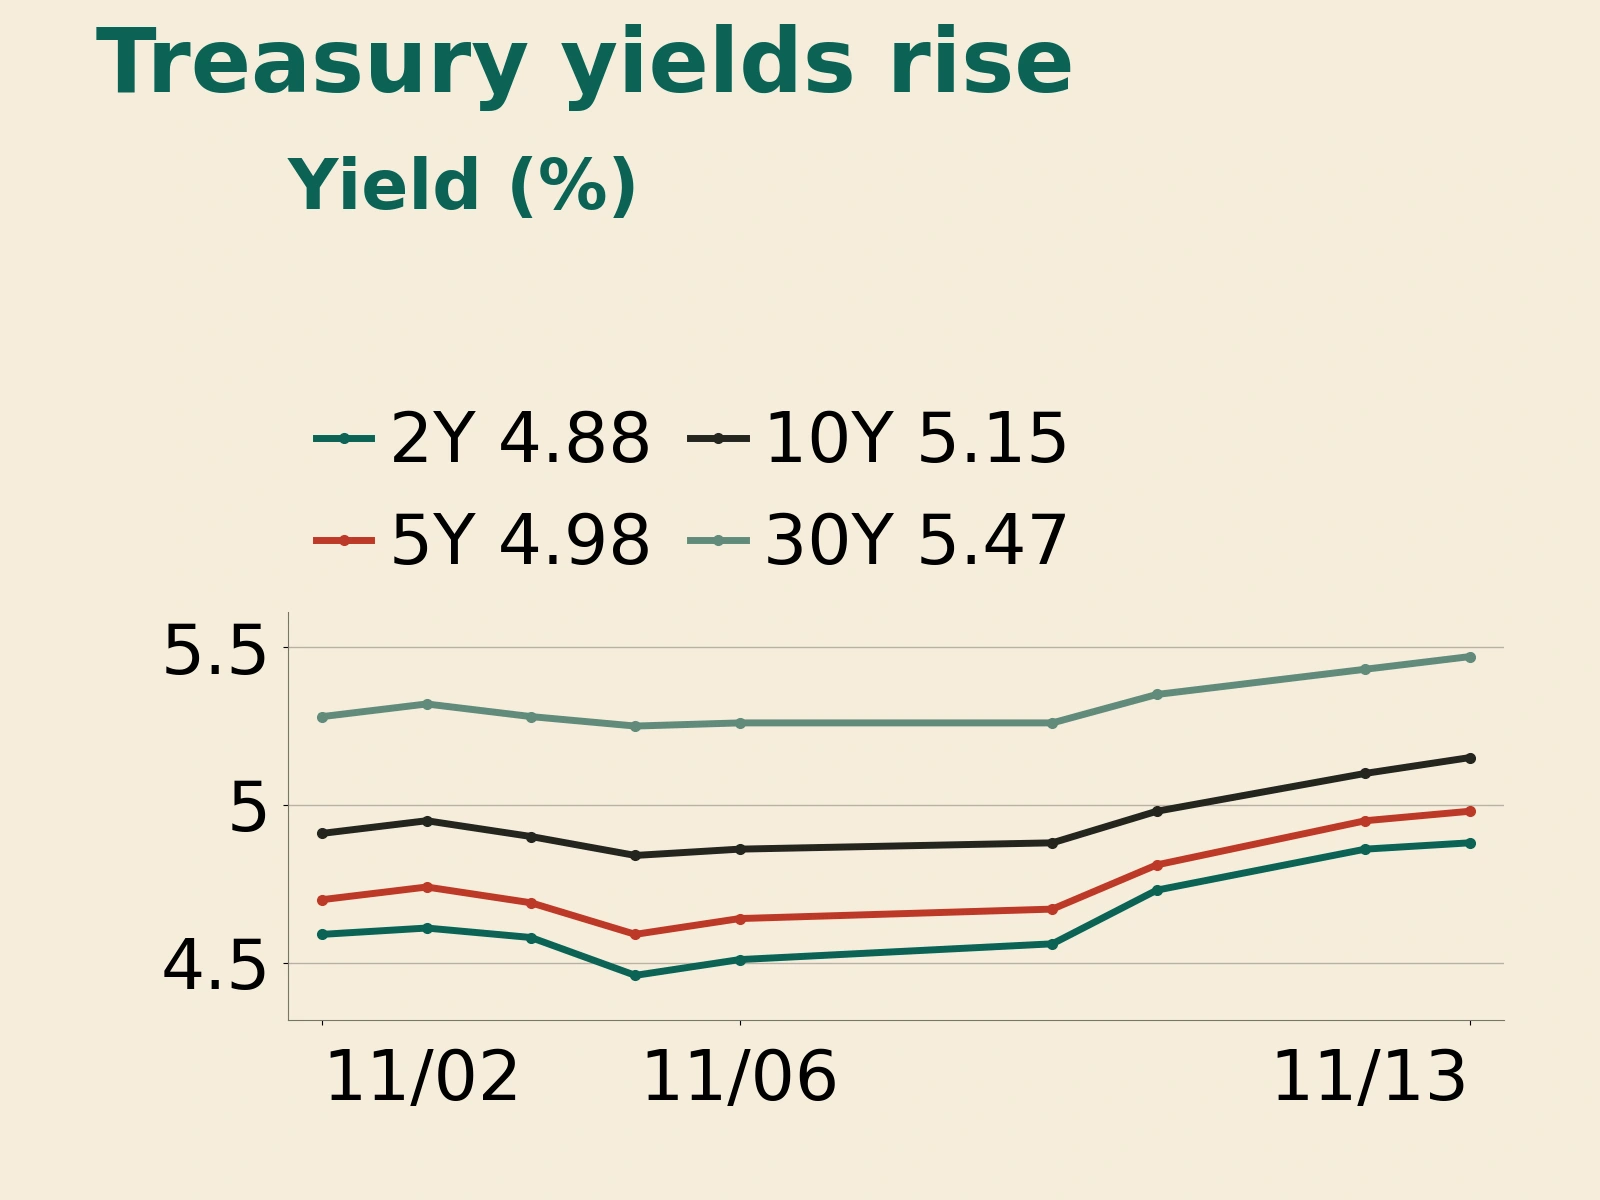
Over the full week, however, the repricing was concentrated at the policy-sensitive end of the curve. Relative to November 6, the two-year Treasury yield jumped 37 basis points and the 10-year yield rose 29 basis points, indicating that the short end had already priced in a more hawkish policy-rate path. Against that backdrop, the rise in short-term yields moderated on Friday, while the long end continued to absorb higher required real returns and pressure from bond supply.
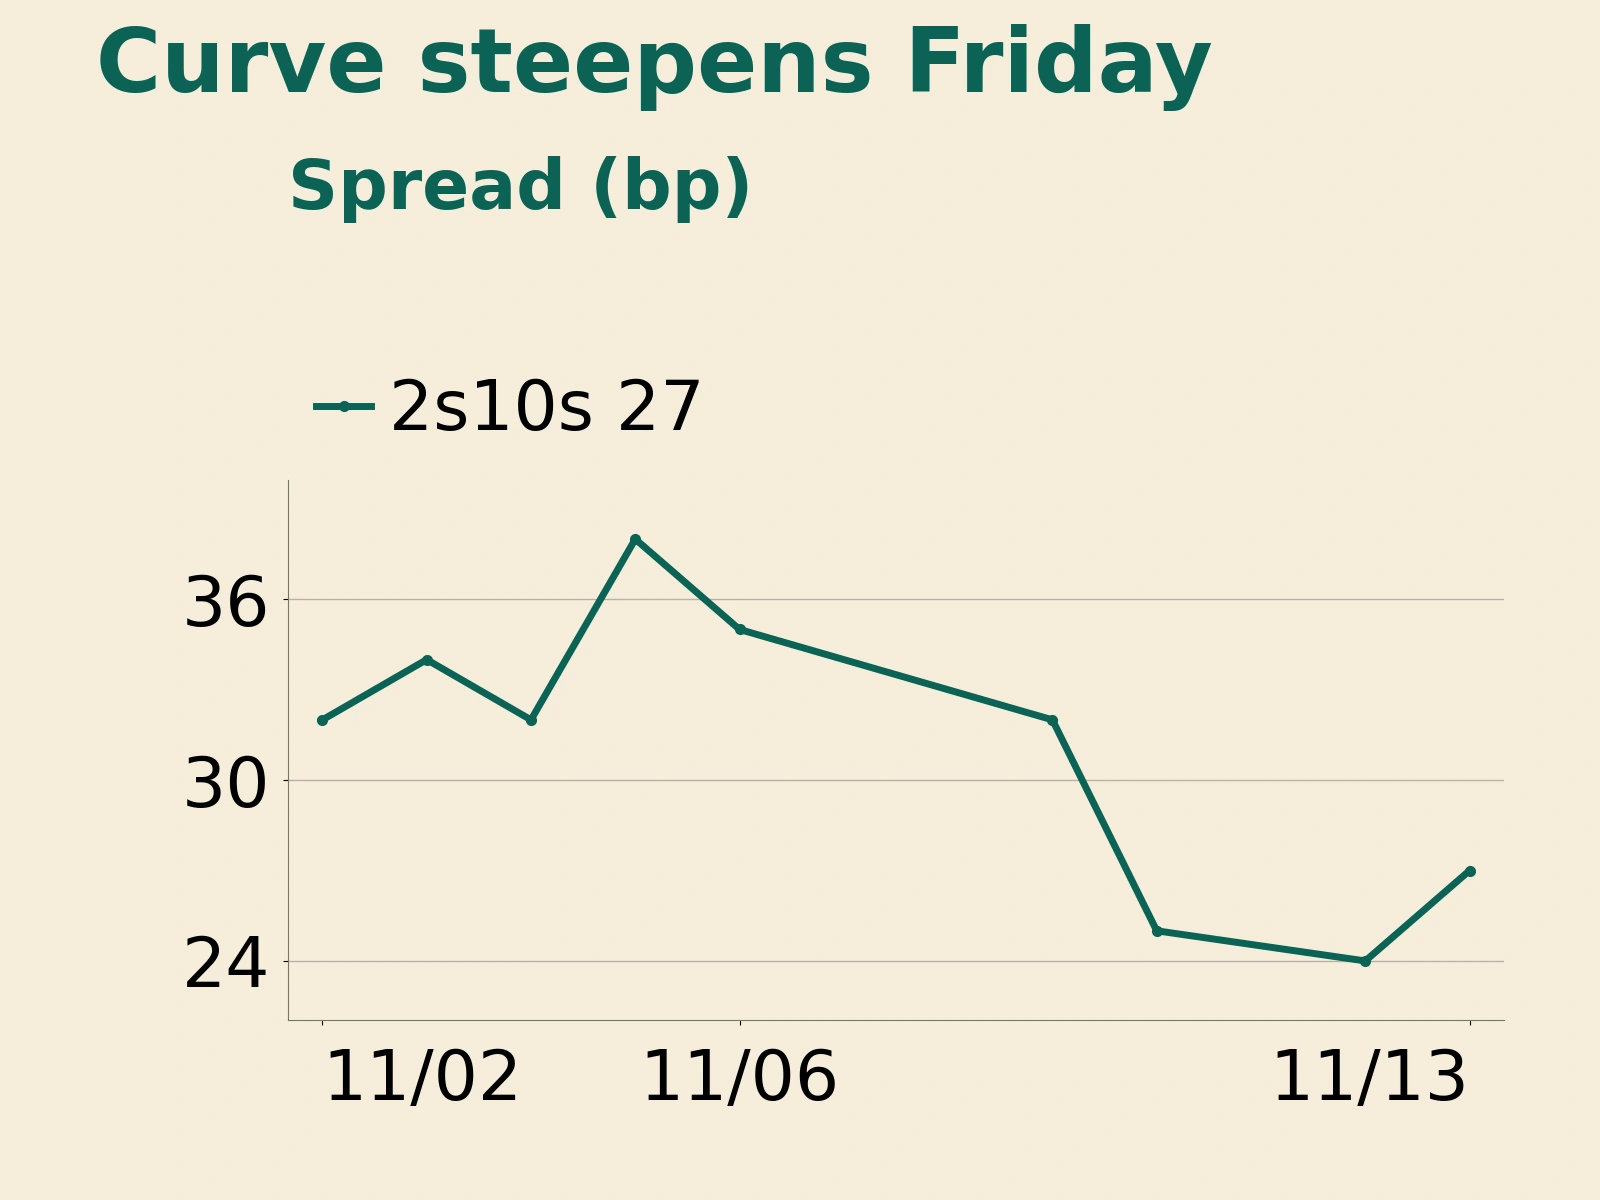
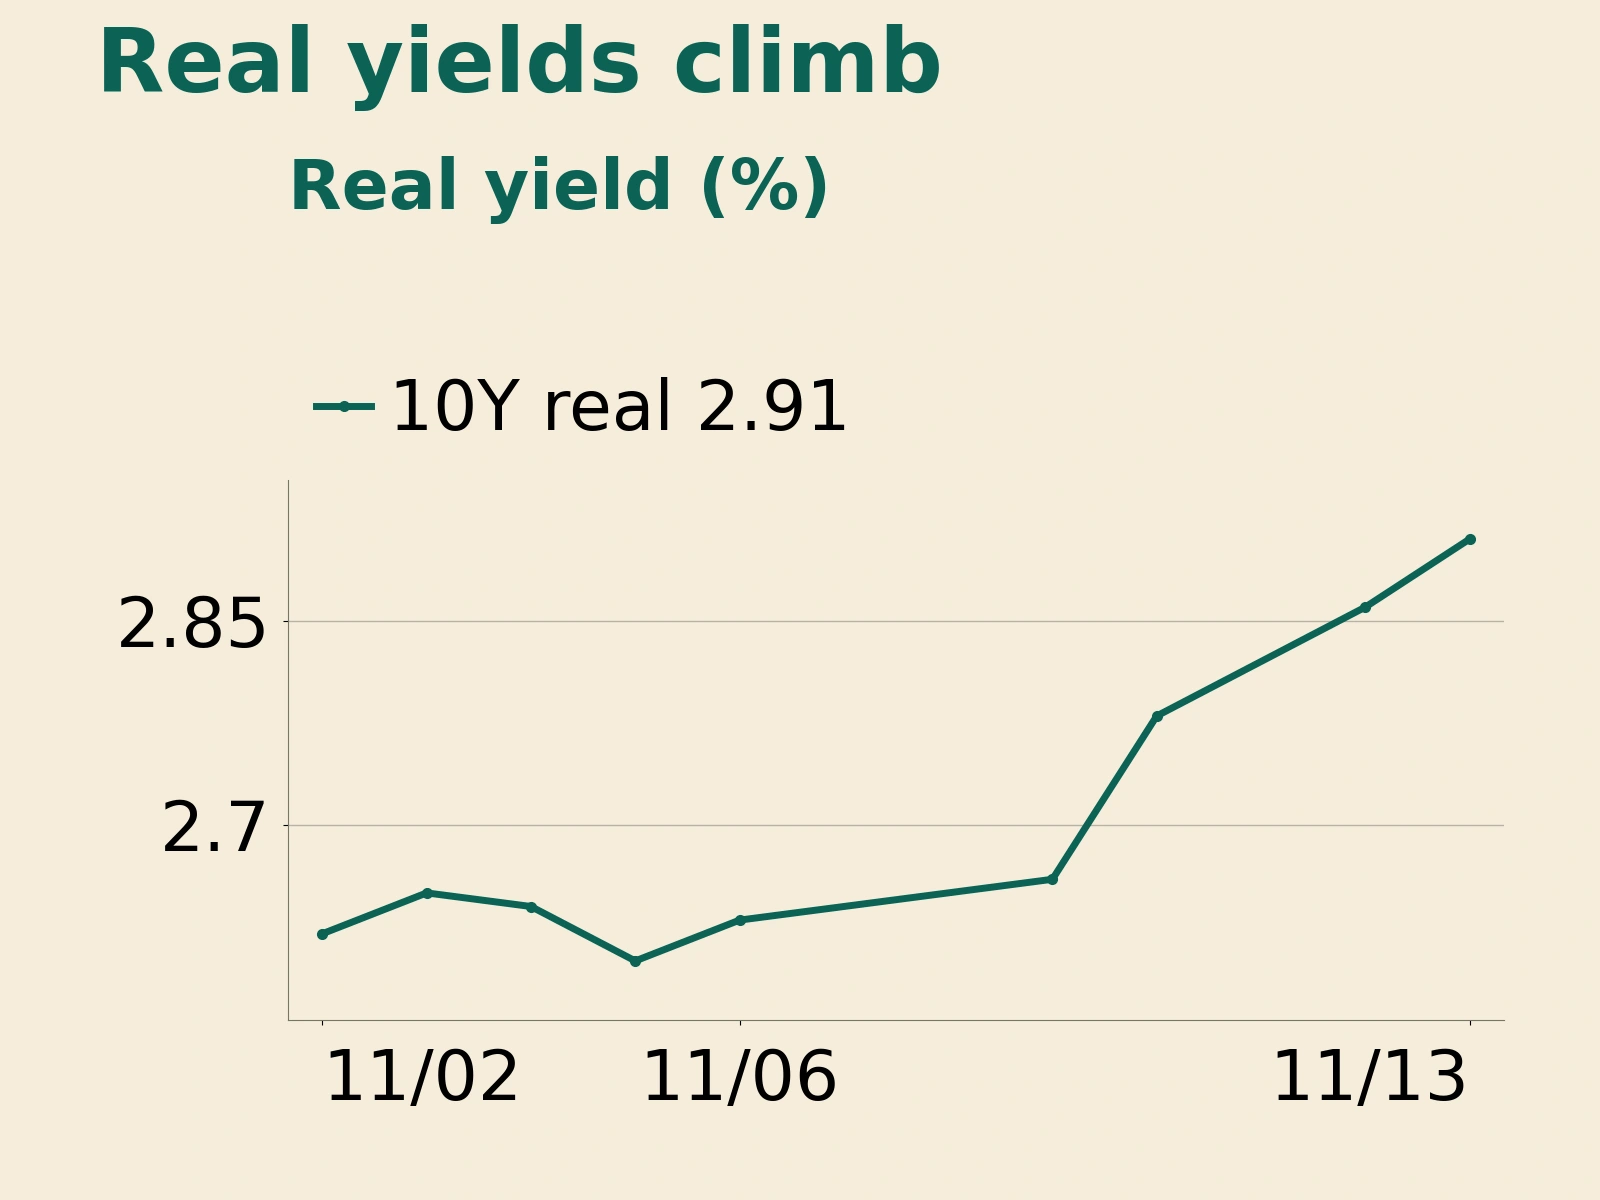
Changes in real yields corroborated this discount-rate pressure. Treasury Department data showed the 10-year real yield rising from 2.86% on November 12 to 2.91%, matching the 5-basis-point increase in the nominal yield of the same maturity; the five-year real yield rose 4 basis points to 2.68%. The gap between 10-year nominal and real yields remained around 2.24%, suggesting that the day's increase in long-term rates was driven primarily by a higher real discount rate. This directly depressed the prices of outstanding long-duration bonds and raised the hurdle for long-duration equity valuations and corporate refinancing.
Institutions nevertheless remain sharply divided over the future path of interest rates. Nasdaq's economic research team noted on November 13 that derivatives markets were pricing in almost 90 basis points of cumulative rate increases by the end of 2027, roughly twice the amount a week earlier. Standard Chartered's baseline forecast, published the same day, envisaged only two increases of 25 basis points each by mid-2027, with scope for cuts in the second half of 2027 if energy prices continued falling and core inflation cooled. The gap between the market's aggressive tightening expectations and the policy ultimately delivered leaves room for repricing.
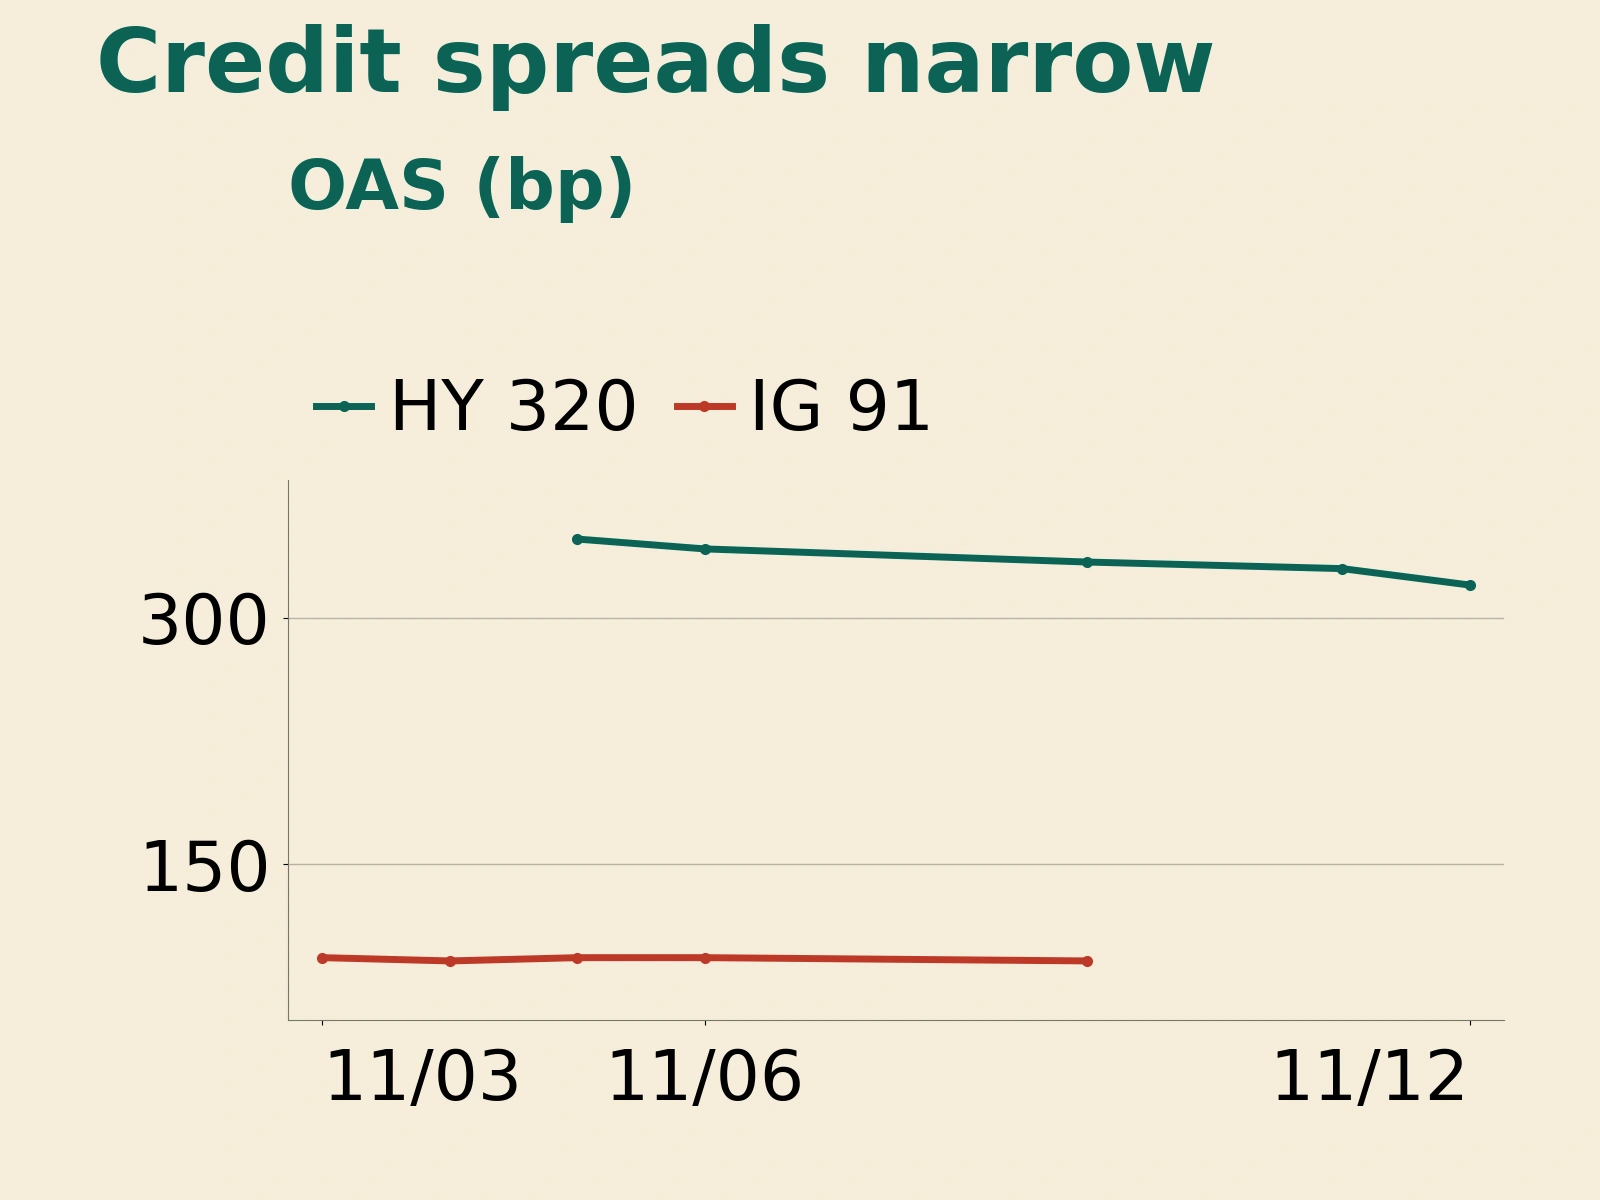
Despite rising risk-free rates, corporate credit risk premiums remain moderate. According to ICE BofA indices updated on November 13, the U.S. high-yield option-adjusted spread (OAS) closed at 320 basis points on November 12, narrowing 10 basis points from November 11 and standing below the 342 basis points recorded on November 6. The investment-grade spread was 91 basis points on November 9, also below its November 6 reading of 93 basis points. Rising Treasury benchmark yields alongside the earlier narrowing in credit spreads suggest that duration pressure has yet to turn into a broad credit contraction.
In this environment, highly rated multinational companies are actively broadening their cross-border financing channels. Reuters reported on November 12, citing deal terms, that Alphabet had issued its first Hong Kong dollar and Singapore dollar bonds, raising about US$3.8 billion in total against orders exceeding US$7 billion. The HK$16 billion portion carried coupons of 4.35%, 4.70% and 5.20% for two-, five- and 10-year maturities, respectively, all below initial price guidance. This points to abundant demand for high-quality assets in Asian local-currency funding pools. For issuers dependent on dollar bond markets, however, total refinancing costs remain anchored to Treasury benchmarks, and moderate credit spreads cannot fully offset the rise in benchmark yields.
The Philadelphia Semiconductor Index falls 3.4% as AI repricing drives sector rotation
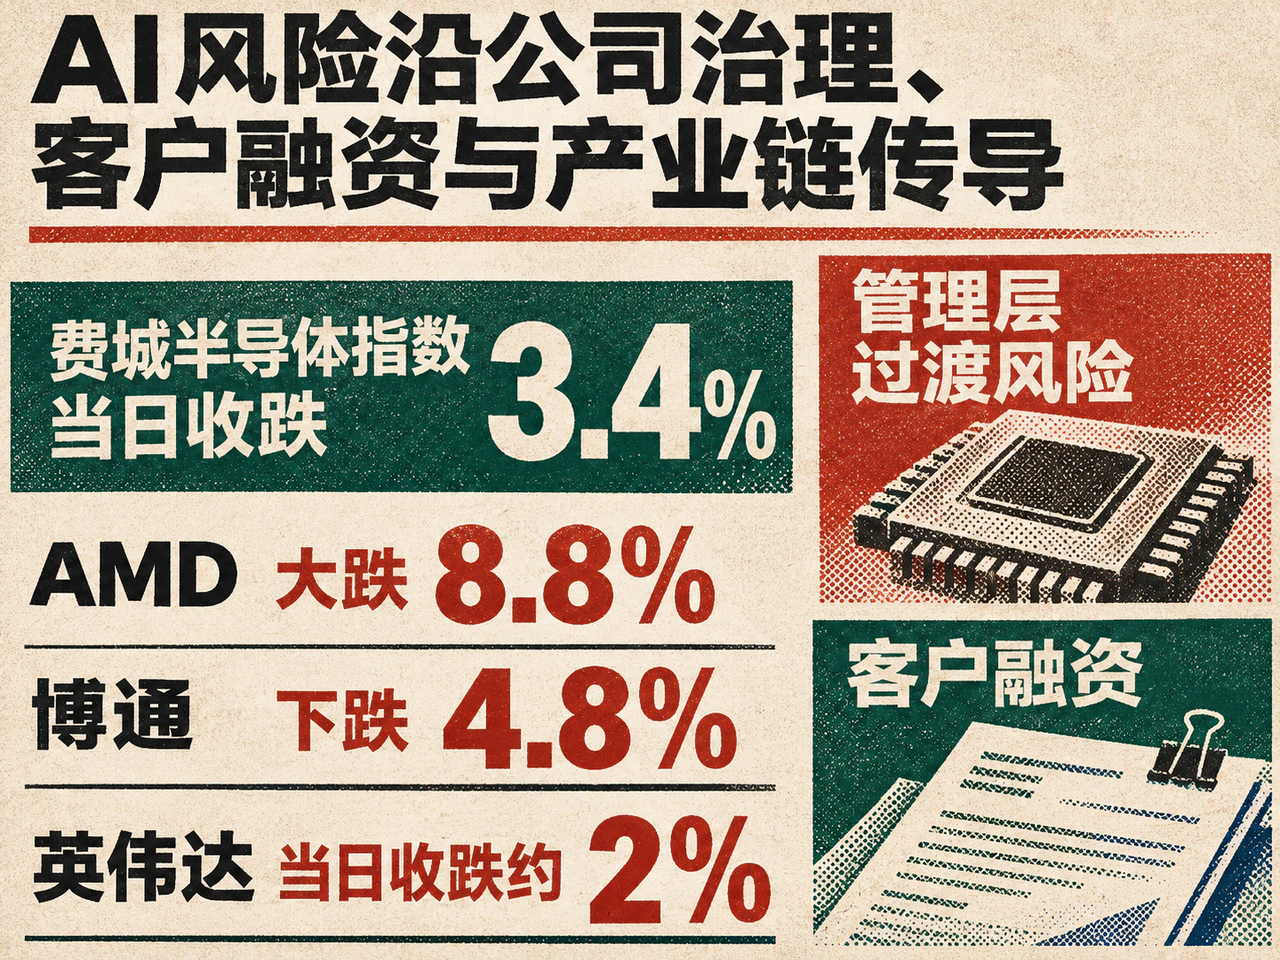
The AI supply chain was the main drag on equities. Following the departure of Nvidia founder Jensen Huang on November 12, investors continued assessing leadership-transition risks on November 13. Nvidia closed down about 2% and recorded its sixth consecutive weekly decline. CNBC reported that chief financial officer Colette Kress had become interim chief executive. HSBC subsequently downgraded the stock to Hold, arguing that it lacked sustained support until a long-term succession plan was settled.
The effects of this governance event quickly spread through industry investment and customer-financing links. Thomas Martin, senior portfolio manager at Globalt Investments, said investors were closely watching whether Nvidia's existing ecosystem-financing agreements would be scaled back or terminated, and whether upstream and downstream supply-demand relationships would change. Against this backdrop, the Philadelphia Semiconductor Index closed down 3.4%, AMD plunged 8.8%, Broadcom fell 4.8%, and data-center operators IREN and Applied Digital declined 6.7% and 5.8%, respectively. The simultaneous weakness in competitors and computing-infrastructure companies indicates a systematic reassessment of the entire chain, where AI end demand, financing ties and high valuations are intertwined.
Export-control developments added to uncertainty. U.S. Treasury Secretary Scott Bessent disclosed on November 13 that four agencies, including the Treasury, had been advocating for months to put Singapore-based Megaspeed on the Commerce Department's Entity List, but Commerce, which has enforcement authority, had not acted. Reuters reported that the dispute concerned advanced-chip sales channels and end-customer screening. Tighter enforcement would directly constrain affected companies' addressable markets and delivery schedules while increasing compliance costs for distributors.
Company-level results in semiconductor equipment remained solid, however. Applied Materials' fiscal fourth-quarter results, released after the close on November 12, showed adjusted earnings per share of US$4.16 and revenue of US$10.41 billion, both above the LSEG survey estimates of US$4.05 and US$10.3 billion. The midpoint of its revenue guidance for the following fiscal quarter was US$11.1 billion, also above the consensus of US$10.89 billion. These figures suggest that underlying equipment demand remains supported, with the current sector correction driven more by governance, financing-chain and geopolitical regulatory risks that have raised investors' required equity risk premiums.
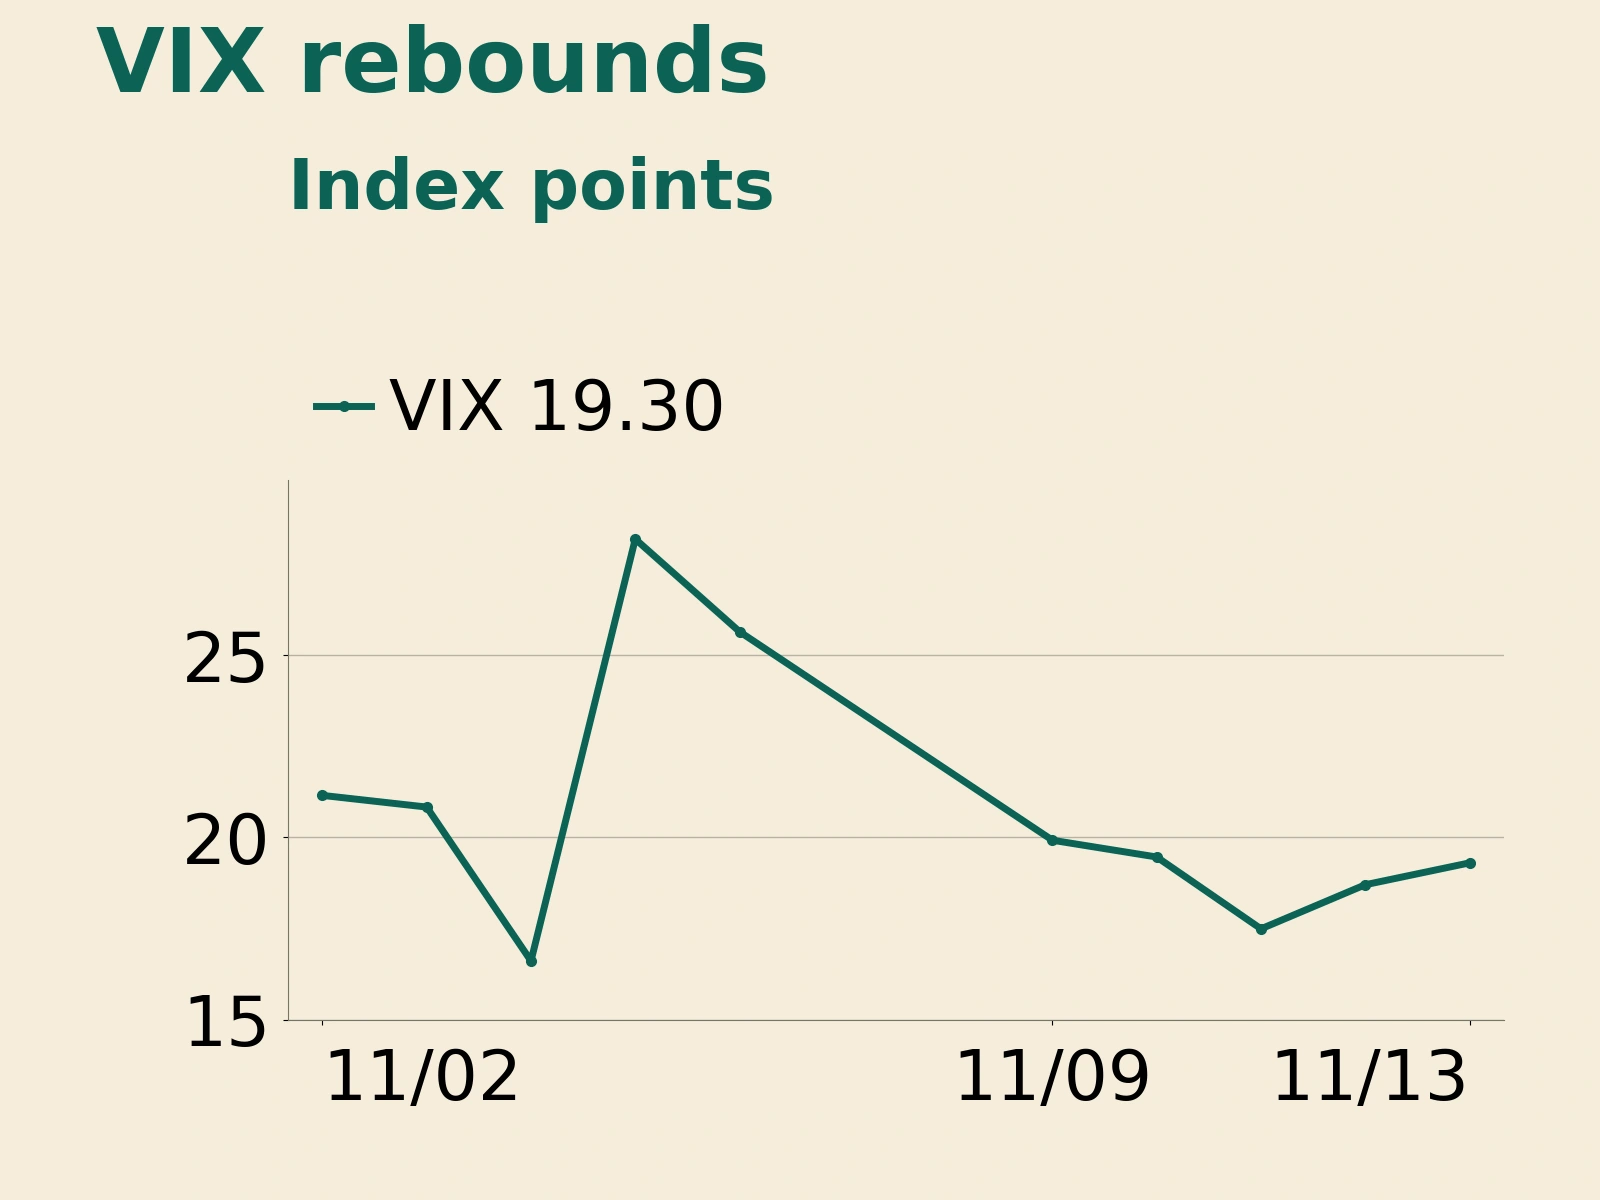
As technology stocks came under pressure, overall risk appetite in U.S. equities also cooled. The VIX rose from 18.70 to 19.30; on Nasdaq, 340 stocks hit 52-week lows, while only 37 reached new highs. Strength in financials and energy cushioned the S&P 500's decline but failed to reverse deteriorating market breadth. Baird investment strategist Ross Mayfield said concerns about returns on enormous AI capital expenditure had already begun weighing on chip stocks and expected money to keep rotating toward non-AI sectors. With elevated real rates compounded by uncertainty within the industry, investors are favoring sectors with stable cash flow and the ability to deliver current earnings.
Global oil supply rises 2.3 million barrels a day; higher real yields restrain gold's rebound
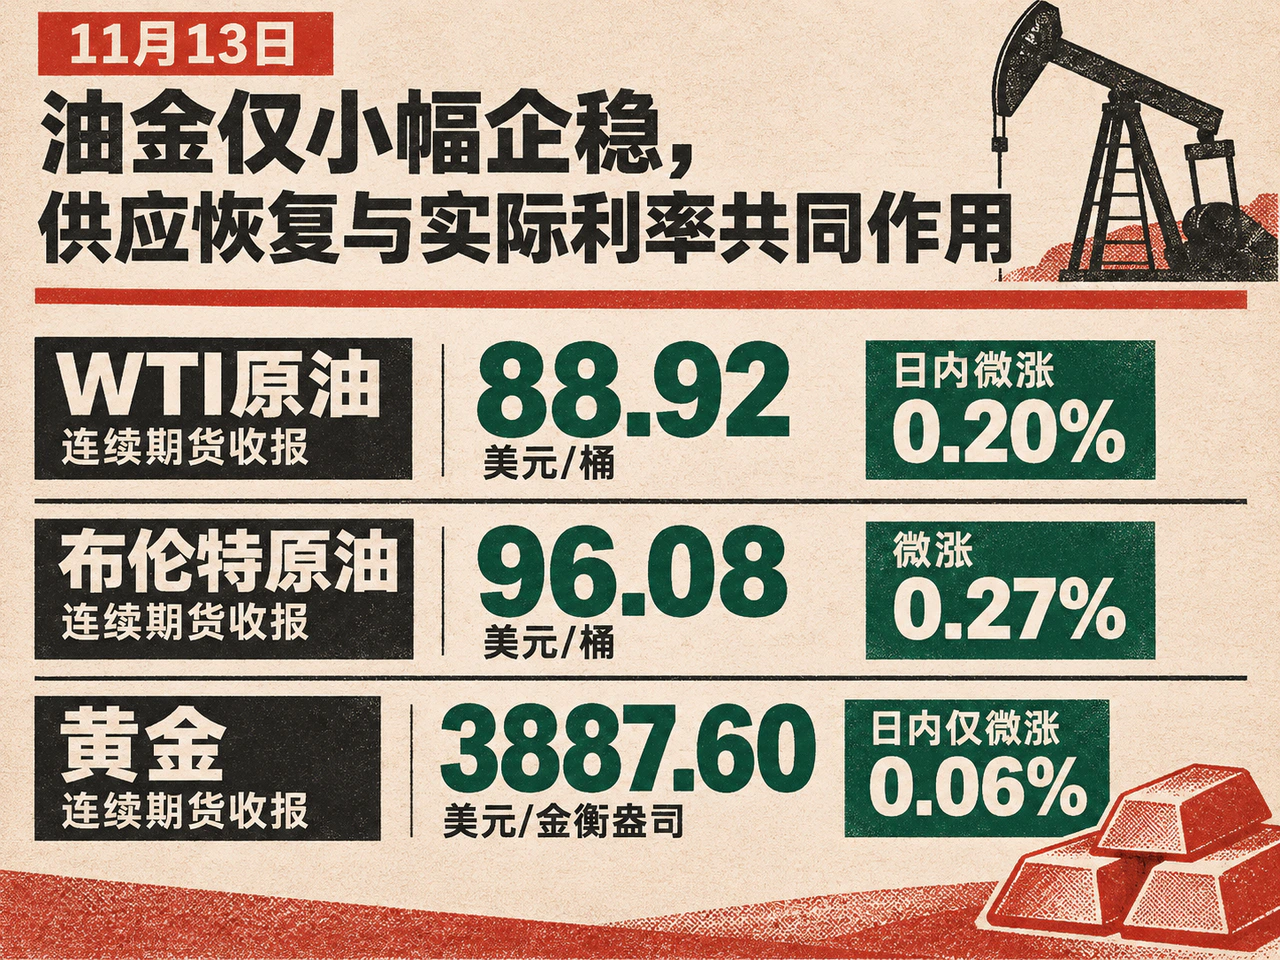
In commodities, crude oil prices stabilized modestly after declining during the week. On November 13, continuous WTI crude futures closed at US$88.92 a barrel, up just 0.20% on the day, while continuous Brent crude futures finished at US$96.08 a barrel, up 0.27%. Both remained below their November 6 closes of US$90.83 and US$98.32 a barrel, respectively.
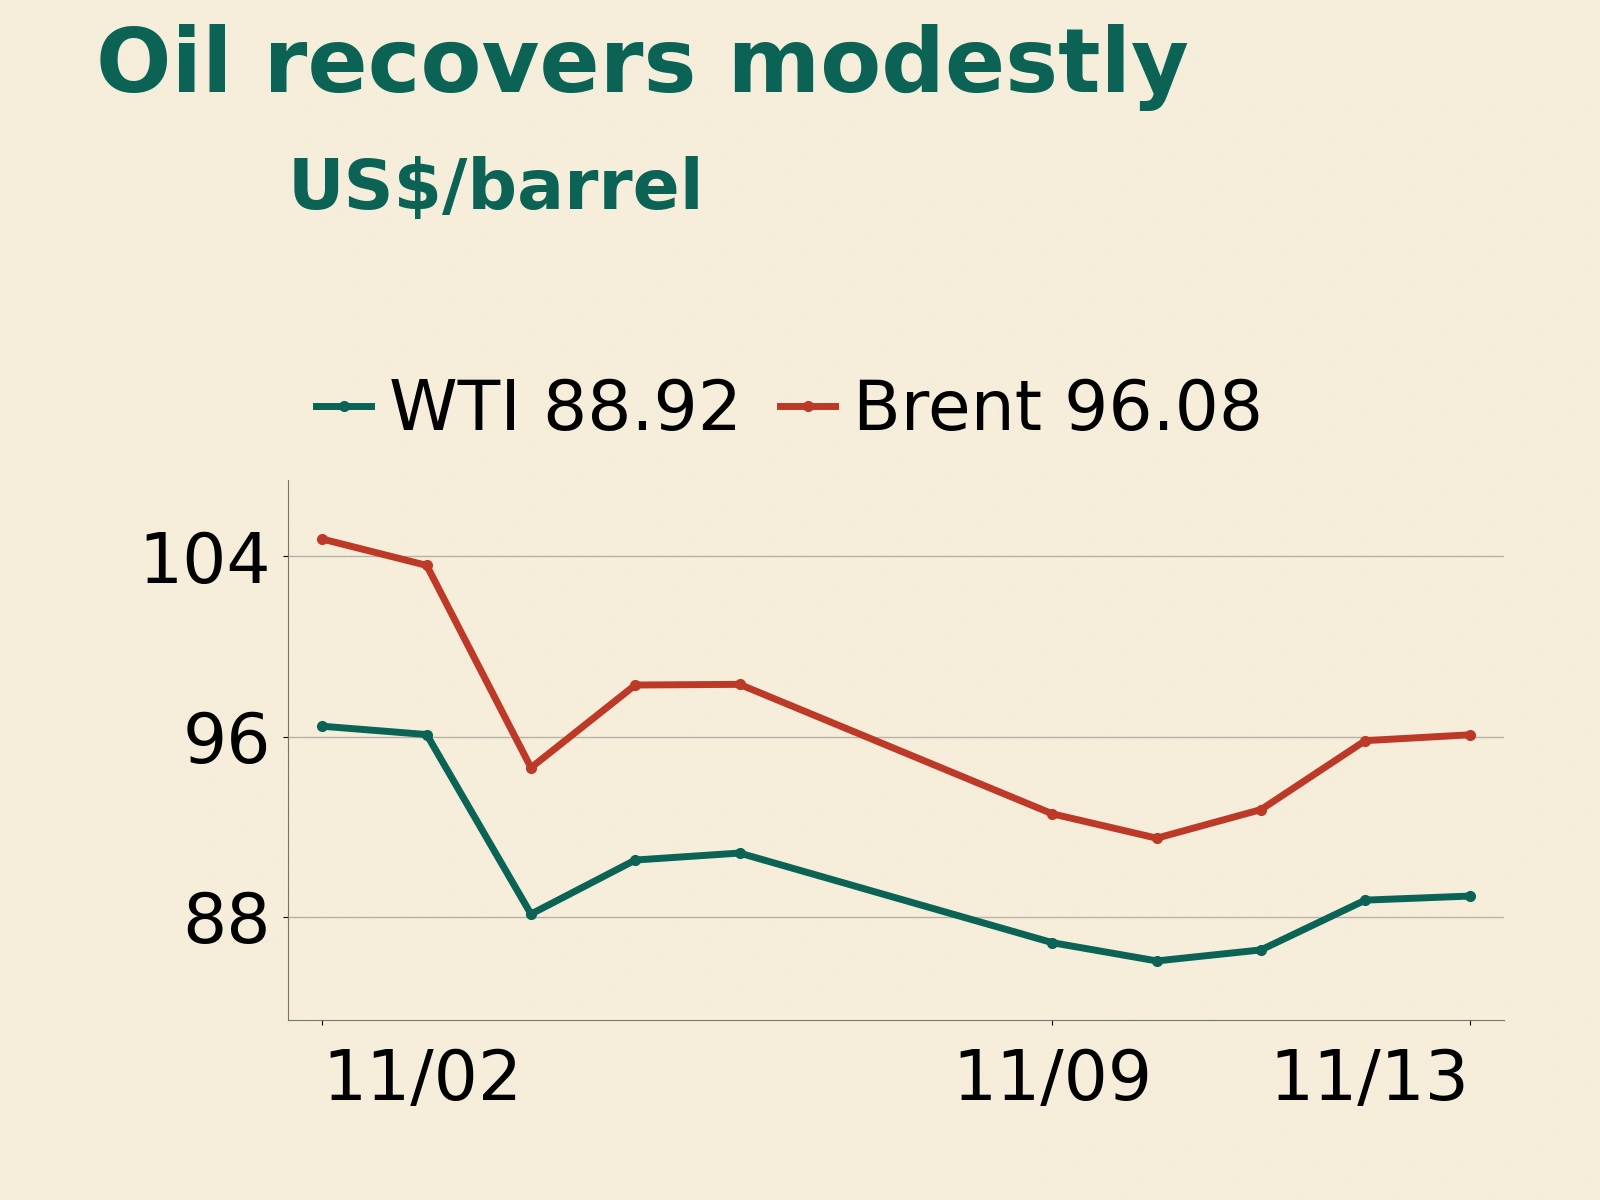
Fundamental data show upstream supply recovering. In its November Oil Market Report, released on November 13, the International Energy Agency (IEA) said global oil supply had increased by 2.3 million barrels a day in October from the previous month to 105.4 million barrels a day. Gulf crude exports excluding Oman had recovered to 15 million barrels a day, around 82% of their prewar level. The IEA accordingly raised its fourth-quarter global supply forecast and expected the crude market to return to surplus, eroding part of the earlier scarcity premium.
Logistics and refining bottlenecks nevertheless continue to impede the transmission of higher crude output into lower end-user energy costs. The IEA reported that global observed oil inventories increased by 52 million barrels in October, including an 86-million-barrel surge in floating storage and oil in transit, while onshore stocks continued declining. This indicates that the additional supply was still in transit. Meanwhile, European diesel prices remained close to US$180 a barrel, 77% above their prewar level. To ease domestic transport bottlenecks, White House officials said on November 13 that the United States had extended its Jones Act shipping waiver by 90 days, continuing to supplement domestic shipping capacity through case-by-case approvals. Fresh claims of attacks in the Middle East continue to affect markets mainly through shipping costs and risk premiums. Whether energy costs can fall meaningfully will depend on sustained Gulf supply recovery and the arrival of crude currently in transit.
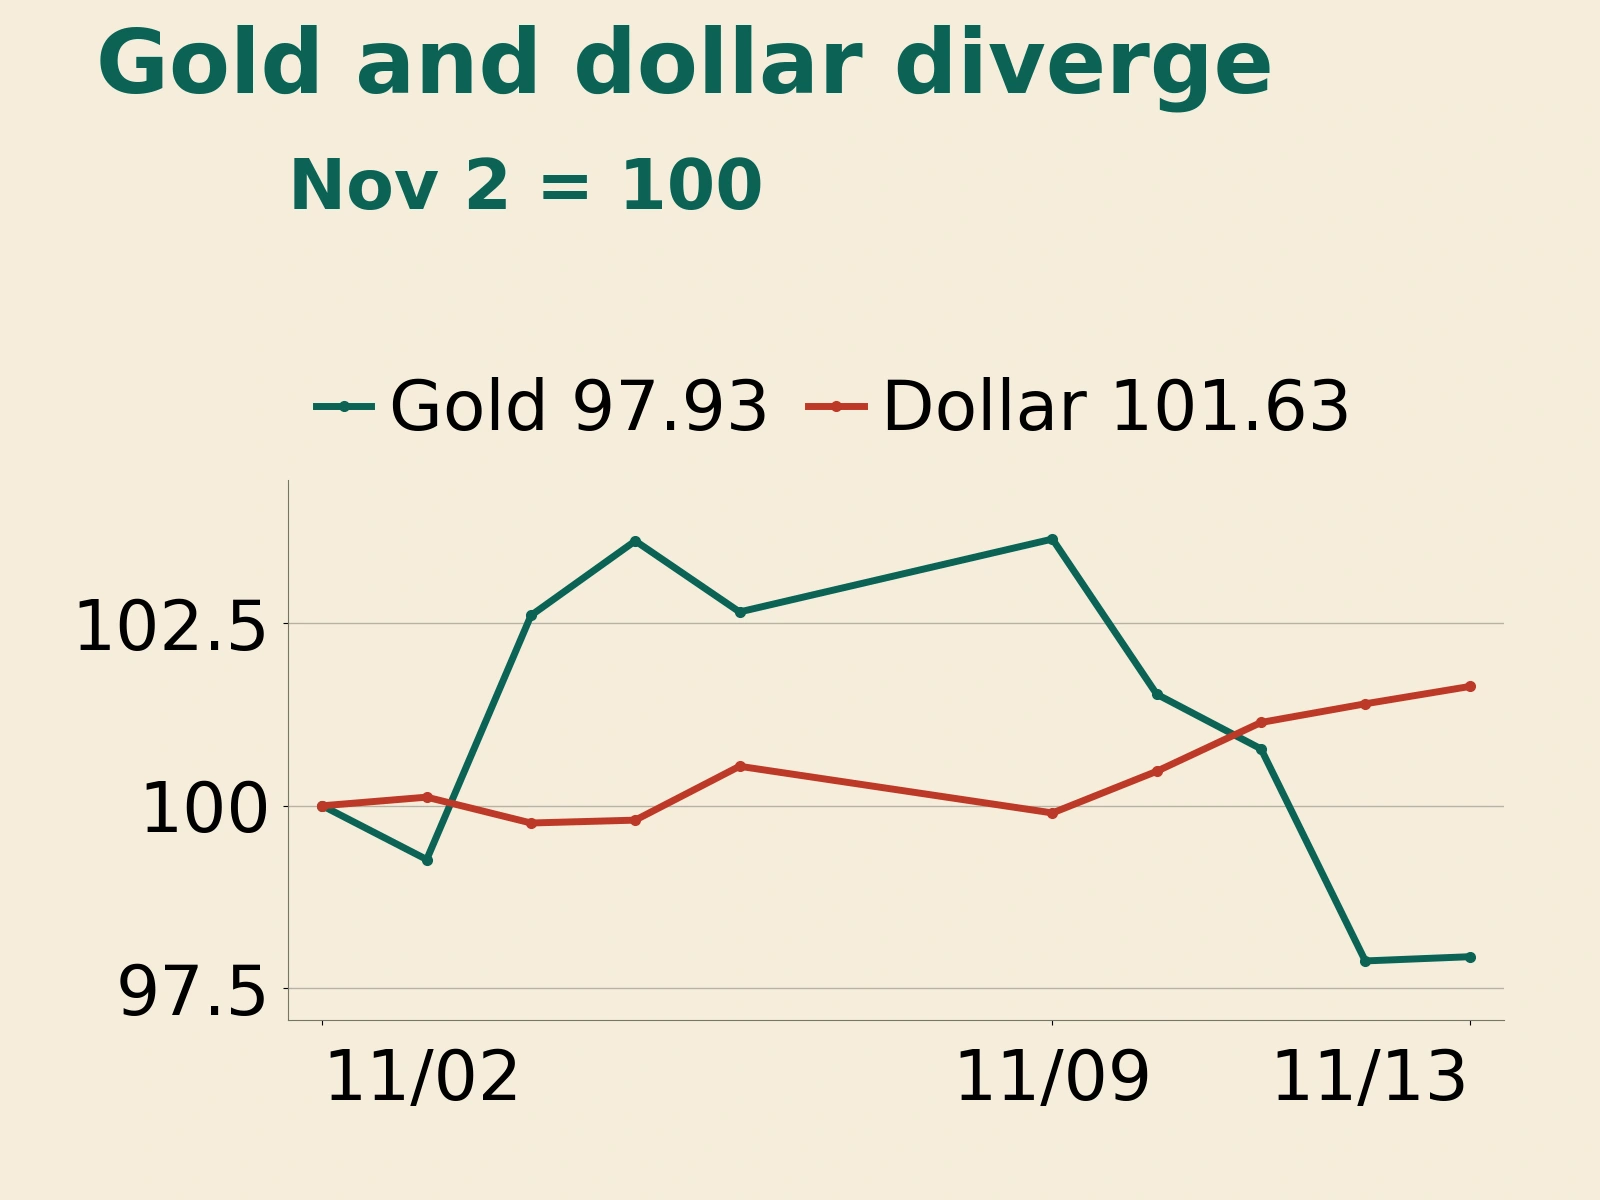
Precious metals were directly constrained by tight financial conditions. Continuous gold futures closed at US$3,887.60 a troy ounce on November 13, edging up just 0.06% and failing to recover the previous session's roughly 2.88% loss. Although spot gold briefly rallied following the PPI release, it surrendered most of those gains as Treasury yields strengthened. A rising dollar index increased the cost for non-U.S. buyers, while higher real Treasury yields further raised the opportunity cost of holding a non-interest-bearing asset. Geopolitical safe-haven demand has so far been insufficient to offset the pressure from high interest rates.
China's October yuan lending contracts by RMB100 billion; Asia-Pacific equities diverge with supply-chain exposure
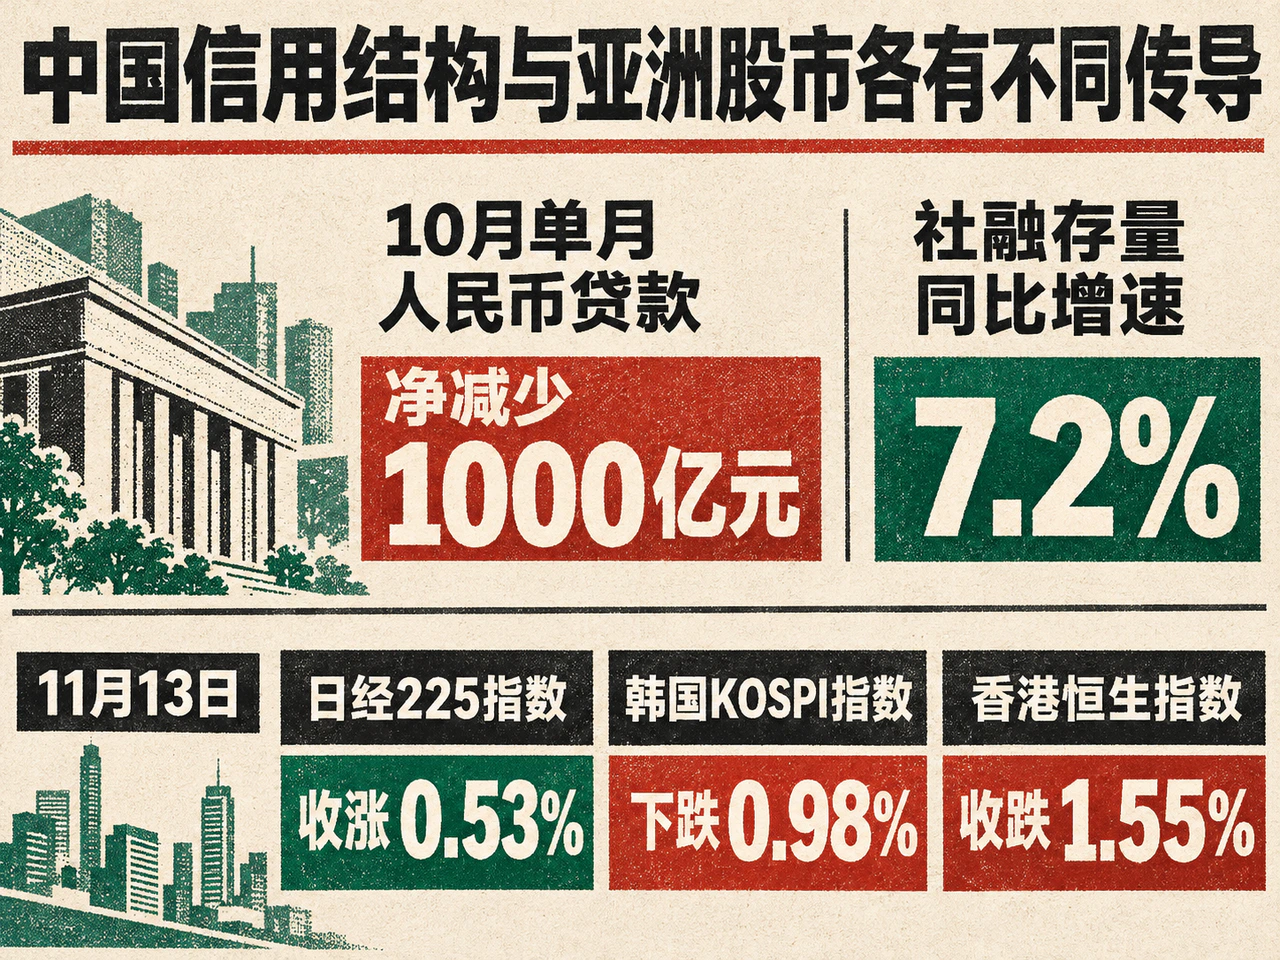
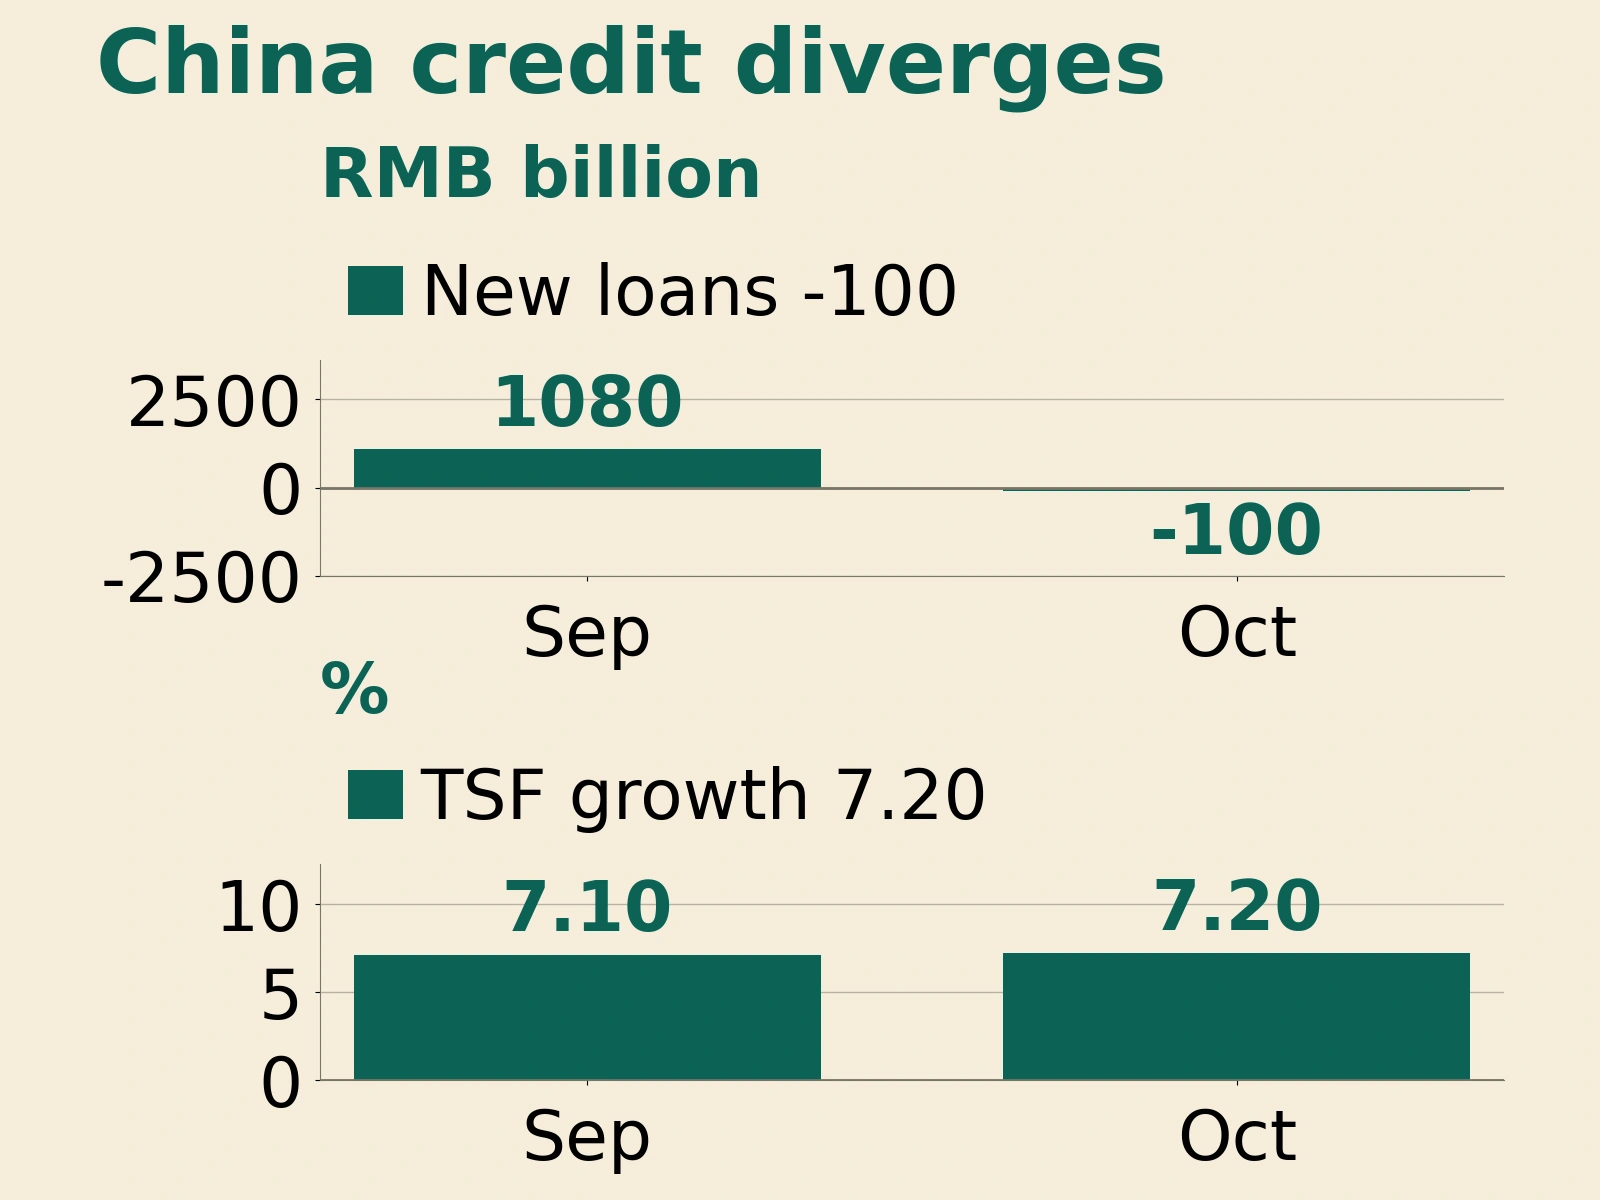
While markets across the Pacific grappled with inflation and interest-rate pressure, China's October financial data showed that real-economy credit demand was still finding a floor. The People's Bank of China reported on November 13 that outstanding yuan loans grew 4.7% year on year at the end of October, slowing 0.1 percentage point from September. Broad money (M2) grew 7.1%, also 0.1 percentage point slower than the previous month. Reuters calculations based on cumulative figures showed a net RMB100 billion decline in yuan loans during October, compared with a net increase of RMB220 billion a year earlier. By sector, household loans fell RMB430 billion, while loans to enterprises and public institutions declined RMB160 billion.
Total social financing, by contrast, stabilized with support from bond issuance. New total social financing was RMB1.15 trillion in October, while growth in the outstanding stock edged up from 7.1% year on year in September to 7.2%. Government bonds outstanding grew 14.4% and corporate bonds outstanding increased 9.6%, both considerably faster than the 4.6% growth in yuan loans to the real economy. Consequently, government bonds' share of outstanding social financing rose to 22.7%, while the yuan-loan share fell to 59.5%. Direct financing, particularly government bonds, is playing an increasingly prominent role in supporting credit expansion.
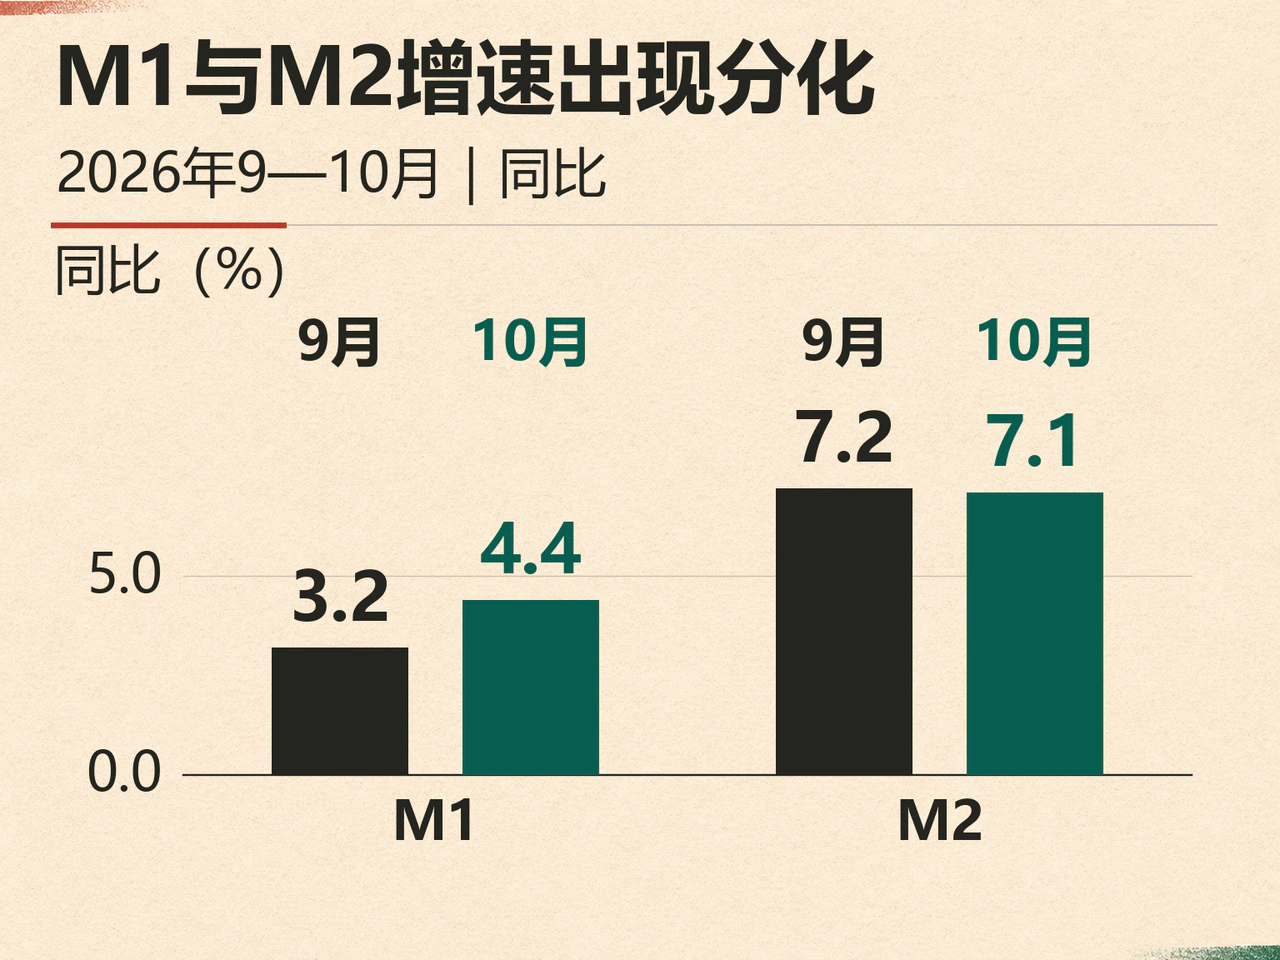
In money markets, interbank liquidity remained ample and funding rates continued to fall. October's monthly weighted-average interbank lending rate was 1.30%, down 0.10 percentage point from the previous month; the weighted-average pledged-repo rate was 1.33%, down 0.07 percentage point. The coexistence of very low money-market funding costs and net loan repayments in the real economy suggests that the transmission of monetary easing into corporate and household borrowing demand still needs to improve. Narrow money (M1) growth nevertheless recovered from 3.2% to 4.4% year on year, a positive sign of greater activity in corporate demand deposits. Whether this translates into medium- and long-term credit expansion and real-economy capital expenditure warrants further attention.
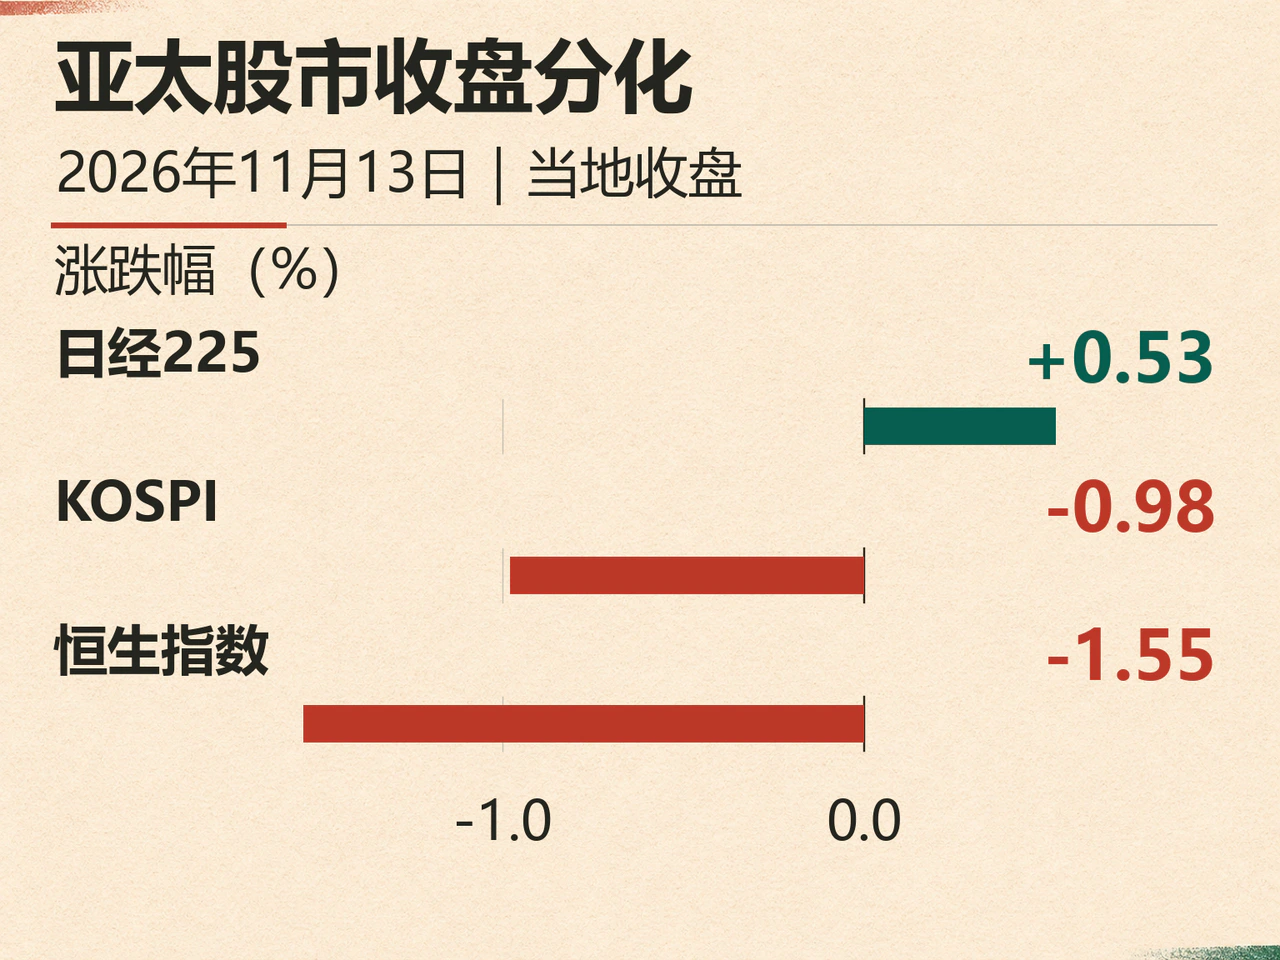
Asia-Pacific equities had already reflected differing valuation dynamics on November 13, before the U.S. close: the Nikkei 225 rose 0.53%, South Korea's KOSPI fell 0.98%, and Hong Kong's Hang Seng Index declined 1.55% to 23,637.60. After the weekend break, the region's markets are likely to diverge further at next week's open according to their supply-chain exposure. Korean memory-chip companies and Japanese semiconductor equipment and materials businesses will more directly reflect spillovers from the reassessment of U.S. AI capital expenditure and customer-financing expectations. Hong Kong equities, while absorbing higher overseas risk-free rates, will continue to be priced primarily around the pace of recovery in mainland credit demand and corporate earnings.
High financing costs remain a common constraint on global cross-asset pricing, but the ability to withstand them is increasingly uneven across markets and sectors. Recovering global crude supply provides a cushion for future disinflation, and some technology-hardware earnings and corporate credit spreads have shown resilience. Yet logistics bottlenecks near the end of the supply chain, uncertainty over AI-industry financing and weak regional credit demand mean that isolated macroeconomic improvements cannot readily translate into broad corporate margin expansion. This helps explain Friday's rotation in U.S. equities toward traditional defensive and cyclical sectors. A broad recovery in valuations still requires a more favorable combination of lower real Treasury yields and corporate earnings expectations.